The NEW Report: Nurse Employment in Wyoming Hospitals, First Quarter 2006 (2006Q1) Through First Quarter 2008 (2008Q1)
The following text, tables, and graphics were recently produced by Research &
Planning. Complete data for nurses employed in hospitals, ambulatory
health care services, and nursing & residential care can be found at http://doe.state.wy.us/LMI/dashboard/toc.htm.
Registered Nurses (RNs)
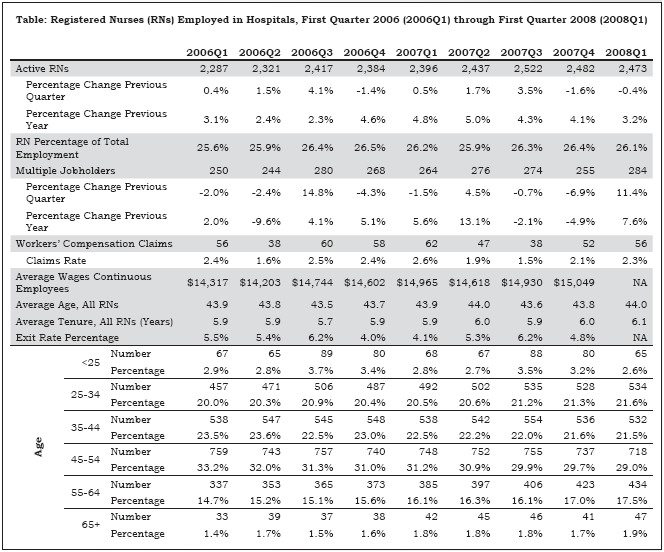
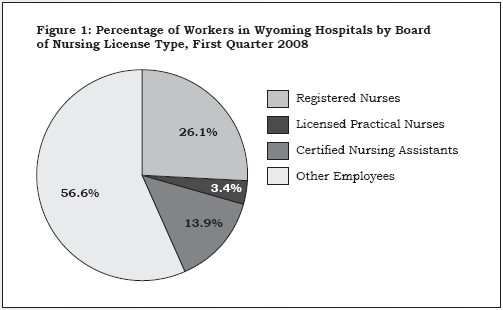
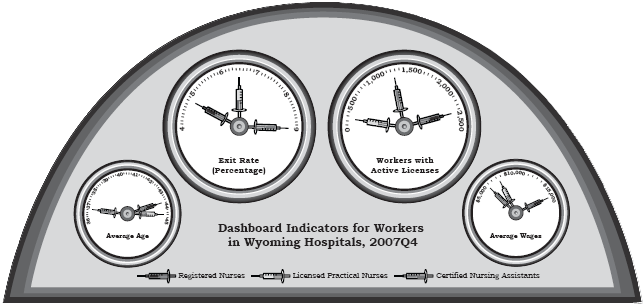
RNs made up 26.1% of hospital employment in 2008Q1 (see Table and Figure 1).
11.5% of RNs were multiple jobholders in 2008Q1.
In 2008Q1 approximately 1 in 50 RNs filed a Workers’ Compensation claim.
Continuously employed RN gross wages grew at an average annual rate of 3.6% between 2006Q1 and 2007Q4.
The average age of RNs in 2008Q1 was 44 years.
Licensed Practical Nurses (LPNs)
LPNs constituted 3.4% of hospital employees in 2008Q1.
9.6% of LPNs held more than one job in 2008Q1.
Continuously employed LPN gross wages grew at an average annual rate of 2.2% between 2006Q1 and 2007Q4.
Certified Nursing Assistants (CNAs)
The number of CNAs working in hospitals grew 4.6% between 2007Q1 and 2008Q1.
CNAs as a proportion of total hospital employment ranged between 13.5% and 13.9% from 2006Q1 to 2008Q1.
The average age of CNAs declined between 2006Q1 and 2008Q1, largely due to an increase in the number and proportion of CNAs in the 25-34 age group.
Industry/Primary Industry – the industry in which licensed professionals earned the most wages each quarter.
Primary Employer – the employer who paid the most wages to a worker in a quarter.
Active RNs, LPNs, or CNAs – the count of licensed professionals who worked in hospitals.
Total Employment – the count of all workers whose primary industry was hospitals.
Multiple Jobholders – the number of licensed professionals paid wages by two or more employers during a quarter.
Workers’ Compensation Claims – the number of workplace injuries reported to Workers’ Compensation each quarter for RNs, LPNs, and CNAs.
Continuous Employees – the number of licensed professionals whose primary industry was hospitals for three consecutive quarters.
Average Wages Continuous Employees – gross quarterly average wages paid to each continuously employed licensed professional.
Tenure – the number of consecutive quarters each licensed professional worked for the same primary employer, allowing for three quarter breaks.
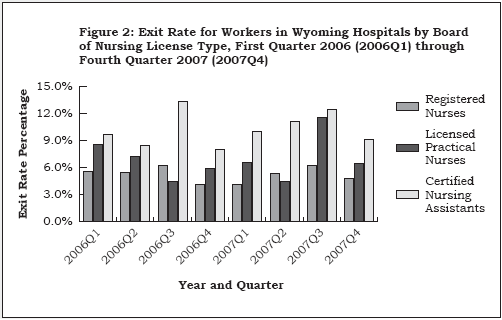
Exit Rate Percentage – the number of licensed professionals whose primary industry was hospitals during the prior quarter and current quarter, but not in the following quarter.
ND (Not Disclosable) – if the number of Workers’ Compensation claims was fewer than five in a quarter, the results were suppressed for confidentiality reasons.
Data sources: Workers’ Compensation Claims data – June 30, 2008; Board of Nursing license file – July 2, 2008; Wage Records database – July 9, 2008; Enhanced Quarterly Unemployment Insurance data – July 29, 2008.
Return to text
Return to text
Last modified on
by April Szuch.
