© Copyright 2006 by the Wyoming Department of Employment, Research & Planning
Vol. 43 No. 9
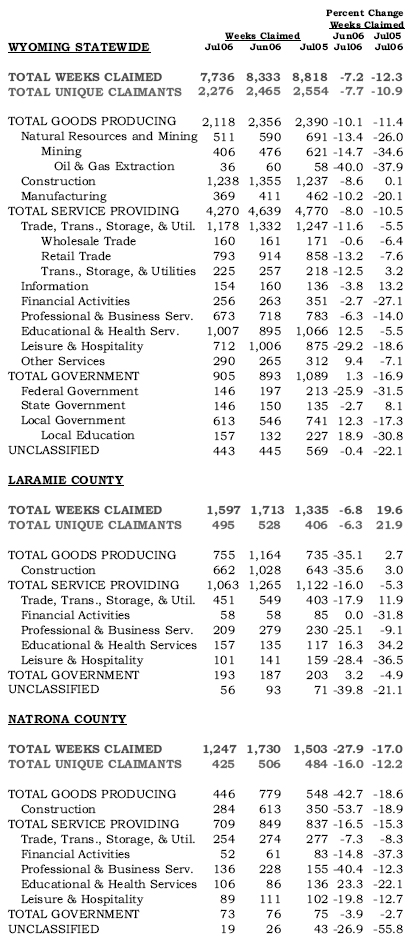
Continued claims declined by 7.2% over the month and 12.3% over the year. Construction claims increased compared to last month.
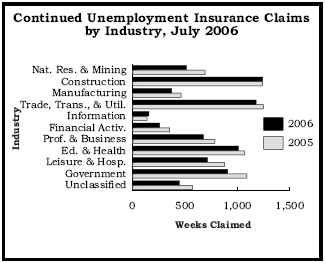
| Continued Claims | July 2006 | July 2005 |
| Natural Resources & Mining | 511 | 691 |
| Construction | 1238 | 1237 |
| Manufacturing | 369 | 462 |
| Trade, Transportation & Utilities | 1178 | 1247 |
| Information | 154 | 136 |
| Financial Activities | 256 | 351 |
| Professional & Business Svc. | 673 | 783 |
| Ed. & Health Svc. | 1007 | 1066 |
| Leisure & Hospitality | 712 | 875 |
| Government | 905 | 1089 |
| Other | 443 | 569 |
| reg_count | cmcy | cmpy | curr_yr | prior_yr |
| YEAR | 2006 | 2005 | July 2006 | July 2005 |
| NORTHWEST | July 2006 | July 2005 | ||
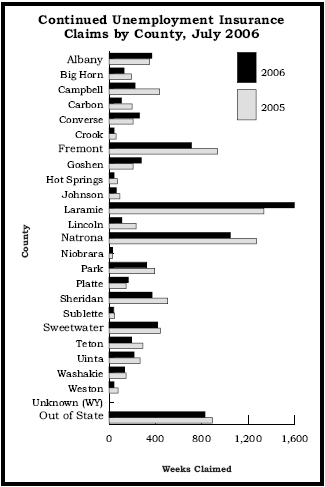
| Big Horn | 129 | 192 | July 2006 | July 2005 |
| Fremont | 711 | 935 | July 2006 | July 2005 |
| Hot Springs | 43 | 71 | July 2006 | July 2005 |
| Park | 322 | 393 | July 2006 | July 2005 |
| Washakie | 133 | 147 | July 2006 | July 2005 |
| NORTHEAST | July 2006 | July 2005 | ||
| Campbell | 225 | 436 | July 2006 | July 2005 |
| Crook | 44 | 61 | July 2006 | July 2005 |
| Johnson | 63 | 92 | July 2006 | July 2005 |
| Sheridan | 370 | 504 | July 2006 | July 2005 |
| Weston | 42 | 78 | July 2006 | July 2005 |
| SOUTHWEST | July 2006 | July 2005 | ||
| Lincoln | 111 | 232 | July 2006 | July 2005 |
| Sublette | 39 | 48 | July 2006 | July 2005 |
| Sweetwater | 418 | 441 | July 2006 | July 2005 |
| Teton | 193 | 292 | July 2006 | July 2005 |
| Uinta | 215 | 268 | July 2006 | July 2005 |
| SOUTHEAST | July 2006 | July 2005 | ||
| Albany | 368 | 349 | July 2006 | July 2005 |
| Goshen | 278 | 208 | July 2006 | July 2005 |
| Laramie | 1598 | 1334 | July 2006 | July 2005 |
| Niobrara | 26 | 29 | July 2006 | July 2005 |
| Platte | 165 | 147 | July 2006 | July 2005 |
| CENTRAL | July 2006 | July 2005 | ||
| Carbon | 107 | 198 | July 2006 | July 2005 |
| Converse | 263 | 207 | July 2006 | July 2005 |
| Natrona | 1046 | 1270 | July 2006 | July 2005 |
| OTHER | July 2006 | July 2005 | ||
| Unknown (WY) | July 2006 | July 2005 | ||
| Out of State | 826 | 890 | July 2006 | July 2005 |
Table of Contents | Labor Market Information | Wyoming
Job Network | Send Us Mail
Last modified on
by Phil Ellsworth.