© Copyright 2006 by the Wyoming Department of Employment, Research & Planning
Vol. 43 No. 8
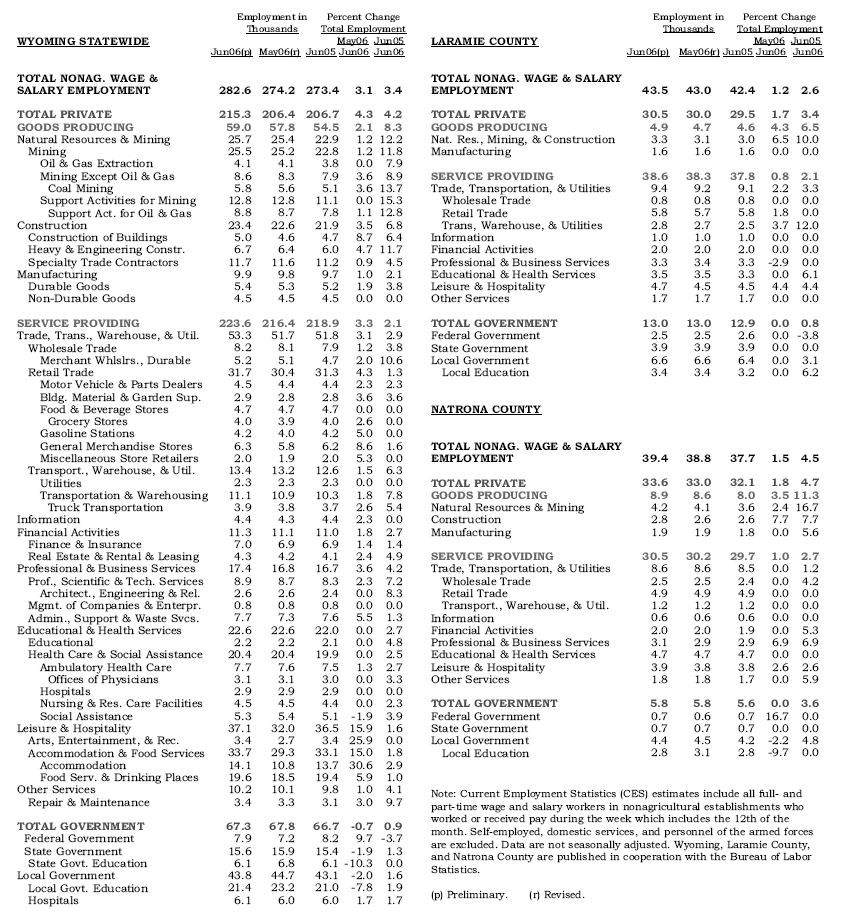
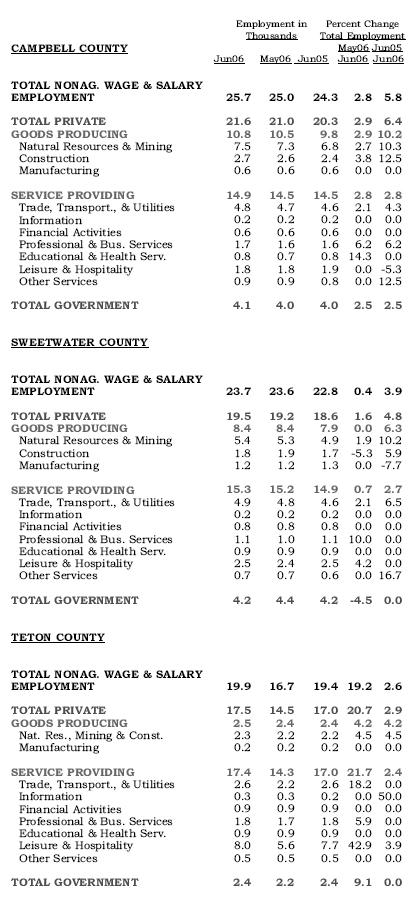
From May to June, employment increased sharply in Leisure & Hospitality (5,100 jobs or 15.9%) as the summer tourist season got into full swing.
| Percent Change | ||||||||||||
| Employment in Thousands | Total Employment | |||||||||||
| WYOMING STATEWIDE | MAY 06 | JUN 05 | ||||||||||
| JUN06(p) | MAY06(r) | JUN05 | JUN 06 | JUN 06 | ||||||||
| TOTAL NONAG. WAGE & SALARY | ||||||||||||
| EMPLOYMENT | 282.6 | 274.2 | 273.4 | 3.1 | 3.4 | |||||||
| TOTAL PRIVATE | 215.3 | 206.4 | 206.7 | 4.3 | 4.2 | |||||||
| GOODS PRODUCING | 59.0 | 57.8 | 54.5 | 2.1 | 8.3 | |||||||
| Natural Resources & Mining | 25.7 | 25.4 | 22.9 | 1.2 | 12.2 | |||||||
| Mining | 25.5 | 25.2 | 22.8 | 1.2 | 11.8 | |||||||
| Oil & Gas Extraction | 4.1 | 4.1 | 3.8 | 0.0 | 7.9 | |||||||
| Mining except Oil & Gas | 8.6 | 8.3 | 7.9 | 3.6 | 8.9 | |||||||
| Coal Mining | 5.8 | 5.6 | 5.1 | 3.6 | 13.7 | |||||||
| Support Activities for Mining | 12.8 | 12.8 | 11.1 | 0.0 | 15.3 | |||||||
| Support Activities for Oil & Gas | 8.8 | 8.7 | 7.8 | 1.1 | 12.8 | |||||||
| Construction | 23.4 | 22.6 | 21.9 | 3.5 | 6.8 | |||||||
| Construction of Buildings | 5.0 | 4.6 | 4.7 | 8.7 | 6.4 | |||||||
| Heavy & Civil Engineering Construction | 6.7 | 6.4 | 6.0 | 4.7 | 11.7 | |||||||
| Specialty Trade Contractors | 11.7 | 11.6 | 11.2 | 0.9 | 4.5 | |||||||
| Manufacturing | 9.9 | 9.8 | 9.7 | 1.0 | 2.1 | |||||||
| Durable Goods | 5.4 | 5.3 | 5.2 | 1.9 | 3.8 | |||||||
| Non-Durable Goods | 4.5 | 4.5 | 4.5 | 0.0 | 0.0 | |||||||
| SERVICE PROVIDING | 223.6 | 216.4 | 218.9 | 3.3 | 2.1 | |||||||
| Trade, Transportation, Warehousing, & Utilities | 53.3 | 51.7 | 51.8 | 3.1 | 2.9 | |||||||
| Wholesale Trade | 8.2 | 8.1 | 7.9 | 1.2 | 3.8 | |||||||
| Merchant Wholesalers, Durable Goods | 5.2 | 5.1 | 4.7 | 2.0 | 10.6 | |||||||
| Retail Trade | 31.7 | 30.4 | 31.3 | 4.3 | 1.3 | |||||||
| Motor Vehicle & Parts Dealers | 4.5 | 4.4 | 4.4 | 2.3 | 2.3 | |||||||
| Building Material & Garden Supplies Dealers | 2.9 | 2.8 | 2.8 | 3.6 | 3.6 | |||||||
| Food & Beverage Stores | 4.7 | 4.7 | 4.7 | 0.0 | 0.0 | |||||||
| Grocery Stores | 4.0 | 3.9 | 4.0 | 2.6 | 0.0 | |||||||
| Gasoline Stations | 4.2 | 4.0 | 4.2 | 5.0 | 0.0 | |||||||
| General Merchandise Stores | 6.3 | 5.8 | 6.2 | 8.6 | 1.6 | |||||||
| Miscellaneous Store Retailers | 2.0 | 1.9 | 2.0 | 5.3 | 0.0 | |||||||
| Transportation, Warehouse, & Utilities | 13.4 | 13.2 | 12.6 | 1.5 | 6.3 | |||||||
| Utilities | 2.3 | 2.3 | 2.3 | 0.0 | 0.0 | |||||||
| Transportation & Warehousing | 11.1 | 10.9 | 10.3 | 1.8 | 7.8 | |||||||
| Truck Transportation | 3.9 | 3.8 | 3.7 | 2.6 | 5.4 | |||||||
| Information | 4.4 | 4.3 | 4.4 | 2.3 | 0.0 | |||||||
| Financial Activities | 11.3 | 11.1 | 11.0 | 1.8 | 2.7 | |||||||
| Finance & Insurance | 7.0 | 6.9 | 6.9 | 1.4 | 1.4 | |||||||
| Real Estate & Rental & Leasing | 4.3 | 4.2 | 4.1 | 2.4 | 4.9 | |||||||
| Professional & Business Services | 17.4 | 16.8 | 16.7 | 3.6 | 4.2 | |||||||
| Professional, Scientific & Technical Services | 8.9 | 8.7 | 8.3 | 2.3 | 7.2 | |||||||
| Architectural, Engineering & Rel. Services | 2.6 | 2.6 | 2.4 | 0.0 | 8.3 | |||||||
| Management of Companies & Enterprises | 0.8 | 0.8 | 0.8 | 0.0 | 0.0 | |||||||
| Administrative & Support & Waste Services | 7.7 | 7.3 | 7.6 | 5.5 | 1.3 | |||||||
| Educational & Health Services | 22.6 | 22.6 | 22.0 | 0.0 | 2.7 | |||||||
| Educational Services | 2.2 | 2.2 | 2.1 | 0.0 | 4.8 | |||||||
| Health Care & Social Assistance | 20.4 | 20.4 | 19.9 | 0.0 | 2.5 | |||||||
| Ambulatory Health Care Services | 7.7 | 7.6 | 7.5 | 1.3 | 2.7 | |||||||
| Offices of Physicians | 3.1 | 3.1 | 3.0 | 0.0 | 3.3 | |||||||
| Hospitals | 2.9 | 2.9 | 2.9 | 0.0 | 0.0 | |||||||
| Nursing & Residential Care Facilities | 4.5 | 4.5 | 4.4 | 0.0 | 2.3 | |||||||
| Social Assistance | 5.3 | 5.4 | 5.1 | -1.9 | 3.9 | |||||||
| Leisure & Hospitality | 37.1 | 32.0 | 36.5 | 15.9 | 1.6 | |||||||
| Arts, Entertainment, & Recreation | 3.4 | 2.7 | 3.4 | 25.9 | 0.0 | |||||||
| Accommodation & Food Services | 33.7 | 29.3 | 33.1 | 15.0 | 1.8 | |||||||
| Accommodation | 14.1 | 10.8 | 13.7 | 30.6 | 2.9 | |||||||
| Food Services & Drinking Places | 19.6 | 18.5 | 19.4 | 5.9 | 1.0 | |||||||
| Other Services | 10.2 | 10.1 | 9.8 | 1.0 | 4.1 | |||||||
| Repair & Maintenance | 3.4 | 3.3 | 3.1 | 3.0 | 9.7 | |||||||
| Government | 67.3 | 67.8 | 66.7 | -0.7 | 0.9 | |||||||
| Federal Government | 7.9 | 7.2 | 8.2 | 9.7 | -3.7 | |||||||
| State Government | 15.6 | 15.9 | 15.4 | -1.9 | 1.3 | |||||||
| State Govt. Education | 6.1 | 6.8 | 6.1 | -10.3 | 0.0 | |||||||
| Local Government | 43.8 | 44.7 | 43.1 | -2.0 | 1.6 | |||||||
| Local Govt Education | 21.4 | 23.2 | 21.0 | -7.8 | 1.9 | |||||||
| Hospitals | 6.1 | 6.0 | 6.0 | 1.7 | 1.7 | |||||||
| Percent Change | ||||||||||||
| Employment in Thousands | Total Employment | |||||||||||
| LARAMIE COUNTY | MAY 06 | JUN 05 | ||||||||||
| JUN06(p) | MAY06(r) | JUN05 | JUN 06 | JUN 06 | ||||||||
| TOTAL NONAG. WAGE & SALARY | ||||||||||||
| EMPLOYMENT | 43.5 | 43.0 | 42.4 | 1.2 | 2.6 | |||||||
| TOTAL PRIVATE | 30.5 | 30.0 | 29.5 | 1.7 | 3.4 | |||||||
| TOTAL GOODS PRODUCING | 4.9 | 4.7 | 4.6 | 4.3 | 6.5 | |||||||
| Nat. Res., Mining & Construction | 3.3 | 3.1 | 3.0 | 6.5 | 10.0 | |||||||
| Manufacturing | 1.6 | 1.6 | 1.6 | 0.0 | 0.0 | |||||||
| TOTAL SERVICE PROVIDING | 38.6 | 38.3 | 37.8 | 0.8 | 2.1 | |||||||
| Trade, Transportation, & Utilities | 9.4 | 9.2 | 9.1 | 2.2 | 3.3 | |||||||
| Wholesale Trade | 0.8 | 0.8 | 0.8 | 0.0 | 0.0 | |||||||
| Retail Trade | 5.8 | 5.7 | 5.8 | 1.8 | 0.0 | |||||||
| Trans, Warehouse, & Utilities | 2.8 | 2.7 | 2.5 | 3.7 | 12.0 | |||||||
| Information | 1.0 | 1.0 | 1.0 | 0.0 | 0.0 | |||||||
| Financial Activities | 2.0 | 2.0 | 2.0 | 0.0 | 0.0 | |||||||
| Professional & Business Services | 3.3 | 3.4 | 3.3 | -2.9 | 0.0 | |||||||
| Educational & Health Services | 3.5 | 3.5 | 3.3 | 0.0 | 6.1 | |||||||
| Leisure & Hospitality | 4.7 | 4.5 | 4.5 | 4.4 | 4.4 | |||||||
| Other Services | 1.7 | 1.7 | 1.7 | 0.0 | 0.0 | |||||||
| Government | 13.0 | 13.0 | 12.9 | 0.0 | 0.8 | |||||||
| Federal Government | 2.5 | 2.5 | 2.6 | 0.0 | -3.8 | |||||||
| State Government | 3.9 | 3.9 | 3.9 | 0.0 | 0.0 | |||||||
| Local Government | 6.6 | 6.6 | 6.4 | 0.0 | 3.1 | |||||||
| Local Education | 3.4 | 3.4 | 3.2 | 0.0 | 6.2 | |||||||
| NATRONA COUNTY | ||||||||||||
| TOTAL NONAG. WAGE & SALARY | ||||||||||||
| EMPLOYMENT | 39.4 | 38.8 | 37.7 | 1.5 | 4.5 | |||||||
| TOTAL PRIVATE | 33.6 | 33.0 | 32.1 | 1.8 | 4.7 | |||||||
| TOTAL GOODS PRODUCING | 8.9 | 8.6 | 8.0 | 3.5 | 11.3 | |||||||
| Natural Resources & Mining | 4.2 | 4.1 | 3.6 | 2.4 | 16.7 | |||||||
| Construction | 2.8 | 2.6 | 2.6 | 7.7 | 7.7 | |||||||
| Manufacturing | 1.9 | 1.9 | 1.8 | 0.0 | 5.6 | |||||||
| TOTAL SERVICE PROVIDING | 30.5 | 30.2 | 29.7 | 1.0 | 2.7 | |||||||
| Trade, Transportation, & Utilities | 8.6 | 8.6 | 8.5 | 0.0 | 1.2 | |||||||
| Wholesale Trade | 2.5 | 2.5 | 2.4 | 0.0 | 4.2 | |||||||
| Retail Trade | 4.9 | 4.9 | 4.9 | 0.0 | 0.0 | |||||||
| Trans, Warehouse, & Utilities | 1.2 | 1.2 | 1.2 | 0.0 | 0.0 | |||||||
| Information | 0.6 | 0.6 | 0.6 | 0.0 | 0.0 | |||||||
| Financial Activities | 2.0 | 2.0 | 1.9 | 0.0 | 5.3 | |||||||
| Professional & Business Services | 3.1 | 2.9 | 2.9 | 6.9 | 6.9 | |||||||
| Educational & Health Services | 4.7 | 4.7 | 4.7 | 0.0 | 0.0 | |||||||
| Leisure & Hospitality | 3.9 | 3.8 | 3.8 | 2.6 | 2.6 | |||||||
| Other Services | 1.8 | 1.8 | 1.7 | 0.0 | 5.9 | |||||||
| Government | 5.8 | 5.8 | 5.6 | 0.0 | 3.6 | |||||||
| Federal Government | 0.7 | 0.6 | 0.7 | 16.7 | 0.0 | |||||||
| State Government | 0.7 | 0.7 | 0.7 | 0.0 | 0.0 | |||||||
| Local Government | 4.4 | 4.5 | 4.2 | -2.2 | 4.8 | |||||||
| Local Education | 2.8 | 3.1 | 2.8 | -9.7 | 0.0 | |||||||
Table of Contents | Labor Market Information |
Wyoming Job Network | Send Us Mail
Last modified on
by Phil Ellsworth.