
Continuing the county analysis which began in the February issue of TRENDS, data from the ES-202 (Covered Employment and Wages) for third quarter 1995 produced the following figures for Wyoming (Statewide) and the selected counties.
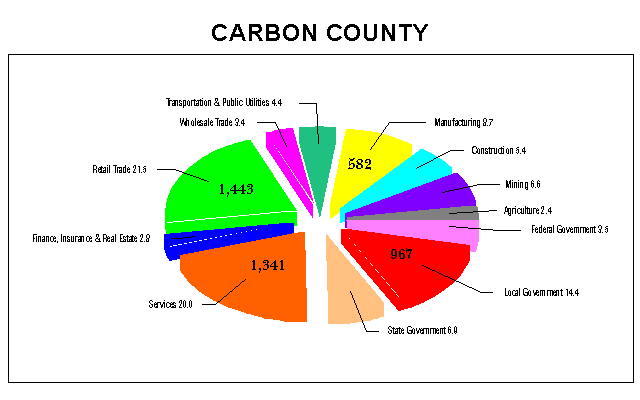
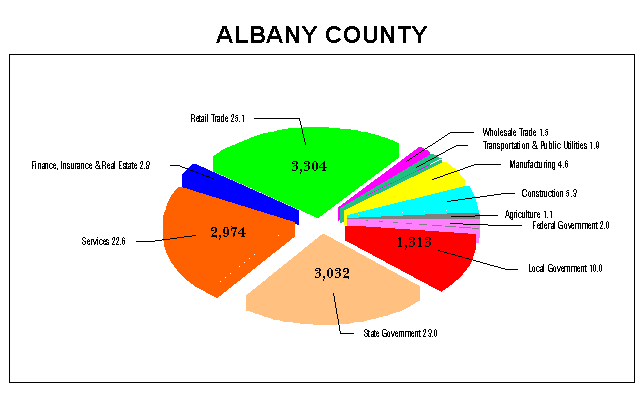
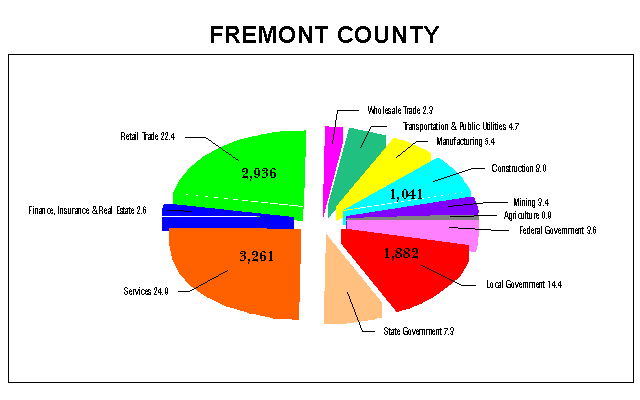
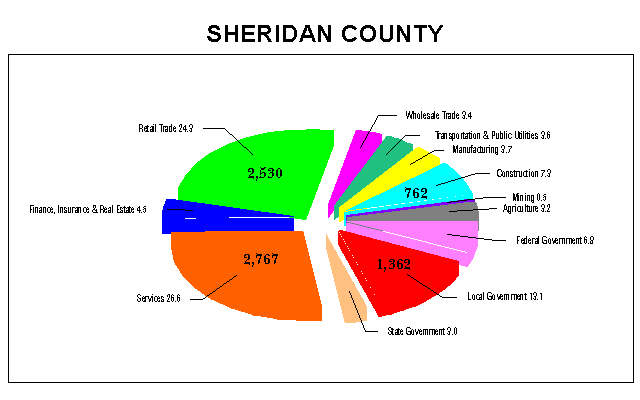
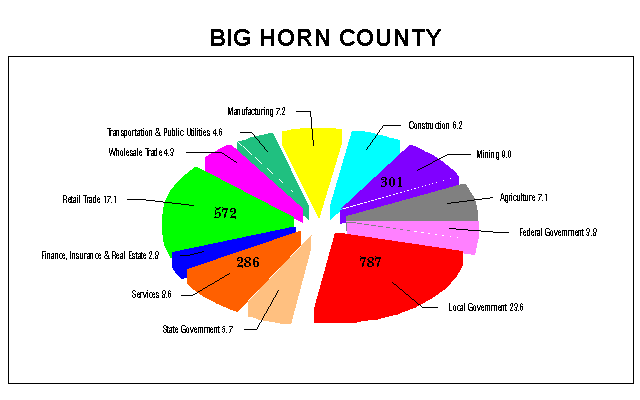
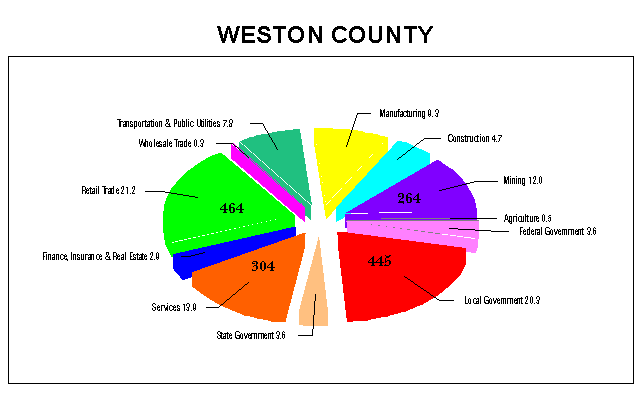
Each Figure includes twelve major industries, and the percent of covered employment in each industry appears next to the industry name. The bold numbers indicate the number of covered workers in the top four industries (by employment) for the state or county for third quarter 1995.
|

|
The four largest industries statewide are again Services, Retail Trade, Local Government and Mining. Local Government decreased from 16.6 percent in second quarter 1995 to 13.3 percent in third quarter 1995, due at least in part to the seasonal decrease in employment in Education. Retail Trade increased slightly from 20.5 percent to 21.6 percent, which may be attributed to tourism.
|
The four largest industries by covered employment in Carbon County are Retail Trade, Services, Local Government and Manufacturing. The industry proportions in Carbon County are roughly comparable to the state as a whole, with the notable exception of Manufacturing, which makes up 8.7 percent of the county's covered workforce compared to 4.5 percent statewide.
|
State Government is the second largest industry in Albany County (23.0% of the covered workforce); a proportion higher than even Laramie County (9.8% in second quarter 1995--see the February issue of TRENDS). Mining is virtually non-existent in Albany County, and Transportation & Public Utilities makes up a smaller percentage than statewide (1.9% versus 5.2%).

|
The top four industries of Sublette County mirror those of Wyoming: Services, Retail Trade, Local Government and Mining. However, Services and Retail Trade are tied for the top covered industry in the county, with 19.4 percent each. Also, Local Government and Mining in the county (16.9% and 11.2%) make up higher proportions than they do statewide (13.3% and 7.9%).
|
Fremont County shares in common with the state as a whole its three largest industries: Services, Retail Trade and Local Government. The percentages of covered workers in these industries are slightly larger in Fremont County than statewide. Mining, which accounts for 7.9 percent of the statewide covered workforce, is noticeably less in Fremont County (3.4%).

|
Similar to Fremont County, the four largest industries in Park County are Services, Retail Trade, Local Government and Construction. Services makes up an even larger proportion of the covered workforce in Park County (27.3%) than in Fremont County (24.9%), or even statewide (22.7%). Mining, at 3.9 percent in Park County, is roughly half the statewide proportion (7.9%).
|
Sheridan County's third quarter 1995 covered employment is comparable to those in Fremont and Park Counties. Mining is an even smaller proportion in Sheridan County (0.5%) than statewide (7.9%) or in Fremont and Park Counties (3.4% and 3.9%, respectively). Covered Agriculture in Sheridan County (3.2%) is roughly double the statewide proportion of 1.5 percent.
|
Local Government is the largest industry in Big Horn County by covered employment. As discussed in the March issue of TRENDS, counties with smaller covered workforces tend to have larger proportions of their employees in Local Government. Agriculture is a much larger portion of Big Horn County's covered workforce (7.1%) than it is statewide (1.5%).
|
Weston County, like Big Horn County, has a comparatively small covered workforce. Local Government is its second largest industry (20.3% of the covered workforce versus 13.3% statewide). Manufacturing is proportionately larger in Weston County (9.3%) than statewide (4.5%), and Wholesale Trade is much smaller (0.3% compared to 3.5% statewide).
The counties of Albany, Carbon, Fremont, Park, Sheridan, Sublette, Big Horn and Weston are diverse in geographic location and industry distribution of covered workers, as well as in the relative sizes of their covered workforces. There are many similarities and differences among counties not discussed here due to time and space constraints, yet much information can be gained even through a brief examination of these figures. The summary data set from which these figures were derived is also found in this issue of TRENDS.
In Big Horn and Weston Counties, the smaller covered workforces are evidenced by the higher proportions of employees within Local Government (refer to the county analysis in the March issue of TRENDS). Big Horn County has 23.6 percent of its covered employment in Local Government and Weston County has 20.3 percent, compared to 13.3 percent statewide. Sublette County also shows this effect to a lesser degree, with 16.9 percent covered workers in Local Government. Carbon, Fremont, Park and Sheridan Counties are all much closer to the statewide proportion, ranging from 13.1 percent to 14.4 percent. Albany County has a lower proportion of covered workers in Local Government, since its three dominant industries (Retail Trade, State Government and Services) account for nearly three-quarters of its covered workforce.
While Construction was the fourth largest industry by covered employment in Fremont, Park and Sheridan Counties in third quarter 1995, this may be the result of seasonal work fluctuations. Data from the 1994 Annual Covered Employment and Wages (a publication available from Research & Planning ... soon available on the Internet via: http://lmi.state.wy.us/) shows that Construction remained the fourth largest industry only in Park County when annual average covered employment was calculated. Future analysis is the only sure way to determine if Construction is on the rise in Park County or if 1994 was an exception.
The May issue of TRENDS will cover the remaining counties: Converse, Goshen, Johnson, Uinta and Washakie, also utilizing Covered Employment and Wage data for third quarter 1995.
Gayle C. Edlin is a Senior Statistician with Research & Planning and is Editor of TRENDS.
| Table of | Labor Market | Employment | Comments on | |||||||||||||||
|---|---|---|---|---|---|---|---|---|---|---|---|---|---|---|---|---|---|---|
| Contents | Information | Resources | TRENDS | |||||||||||||||
 |
 |
 |
 |
|||||||||||||||