Covered Employment and Wages for Third Quarter 2008: Mining Leads Growth in Jobs and Payroll
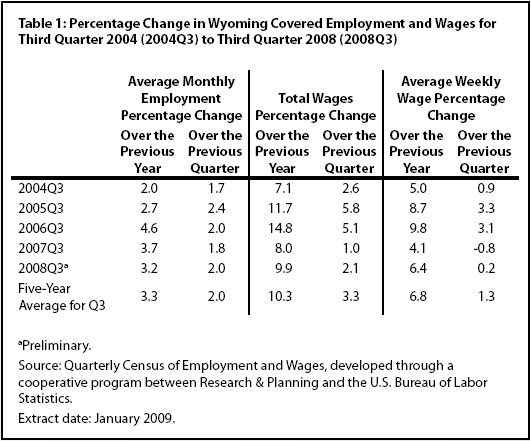
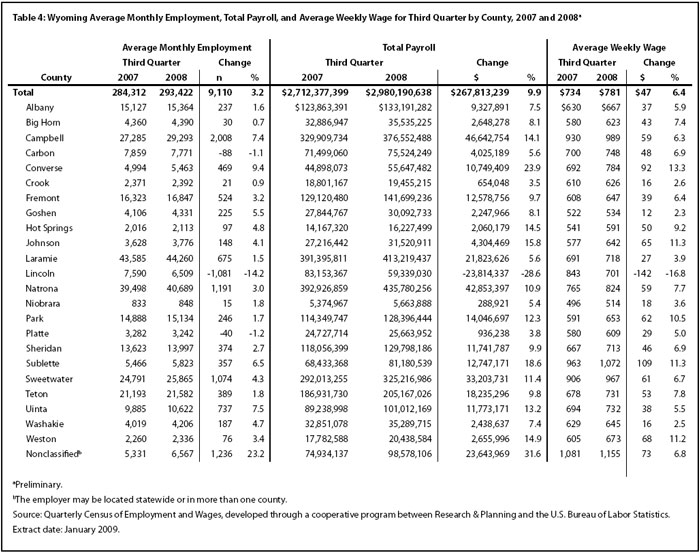
Employment grew by 9,110 jobs (3.2%) in third quarter 2008 and the average weekly wage rose by $47 (6.4%). On an over-the-year basis, employment increased in 20 of Wyoming’s 23 counties.
From third quarter 2007 to third quarter 2008, total unemployment insurance (UI) covered payroll increased by $267.8 million (9.9%). This increase was slightly lower than the five-year average (see Table 1). UI covered payroll represents approximately 92% of all wage and salary disbursements and 45% of personal income in the state (U.S. Bureau of Economic Analysis, 2007). On an over-the-year basis, employment grew by 9,110 jobs (3.2%) in third quarter and the average weekly wage rose by $47 (6.4%). Covered employment and wage data are organized by the North American Industry Classification System (NAICS; U.S. Census Bureau, 2007). NAICS is a system of classifying firms based on their production processes. Firms are then grouped into common categories known as sectors. Across industry sectors, the largest growth in jobs and payroll was found in mining (including oil & gas). It added 2,504 jobs (9.1%) and its payroll increased by $69.6 million (14.5%). Total payroll is an important economic indicator because it is often associated with consumption, retail sales, and sales tax revenue (Black & Evans, 1997).
From third quarter 2007 to third quarter 2008, total unemployment insurance (UI) covered payroll increased by $267.8 million (9.9%). This increase was slightly lower than the five-year average (see Table 1). UI covered payroll represents approximately 92% of all wage and salary disbursements and 45% of personal income in the state (U.S. Bureau of Economic Analysis, 2007). On an over-the-year basis, employment grew by 9,110 jobs (3.2%) in third quarter and the average weekly wage rose by $47 (6.4%). Covered employment and wage data are organized by the North American Industry Classification System (NAICS; U.S. Census Bureau, 2007). NAICS is a system of classifying firms based on their production processes. Firms are then grouped into common categories known as sectors. Across industry sectors, the largest growth in jobs and payroll was found in mining (including oil & gas). It added 2,504 jobs (9.1%) and its payroll increased by $69.6 million (14.5%). Total payroll is an important economic indicator because it is often associated with consumption, retail sales, and sales tax revenue (Black & Evans, 1997).
The covered payroll and employment data in this article are measured by place of work as compared to the labor force estimates, which are a measure of employed and unemployed persons by place of residence. Also, the employment data presented in this article represent a count of jobs, not persons. When individuals work more than one job, each is counted separately.
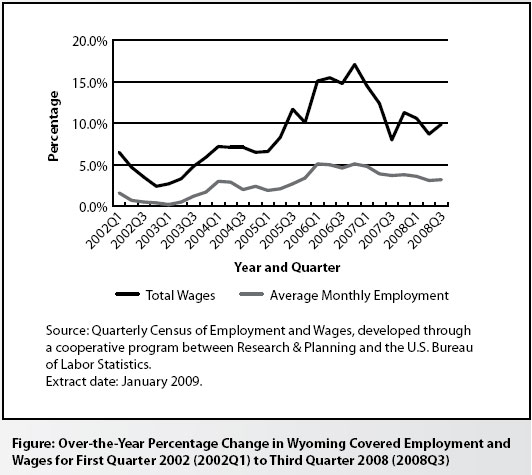
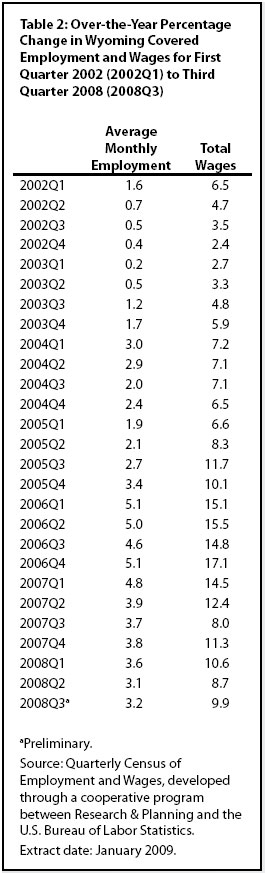
The Figure shows that total payroll growth peaked at 17.1% in fourth quarter 2006, decreased to 8.0% in third quarter 2007, and was 9.9% in third quarter 2008. Employment growth, which stood at 5.1% in fourth quarter 2006, decelerated to 3.2% in third quarter 2008 (see Table 2).
Statewide Employment and Wages by Industry
The purpose of this article is to show employment and payroll changes between third quarter 2007 and third quarter 2008. These economic changes help gauge the overall strength of Wyoming’s economy and identify the fastest and slowest growing sectors and geographic areas.
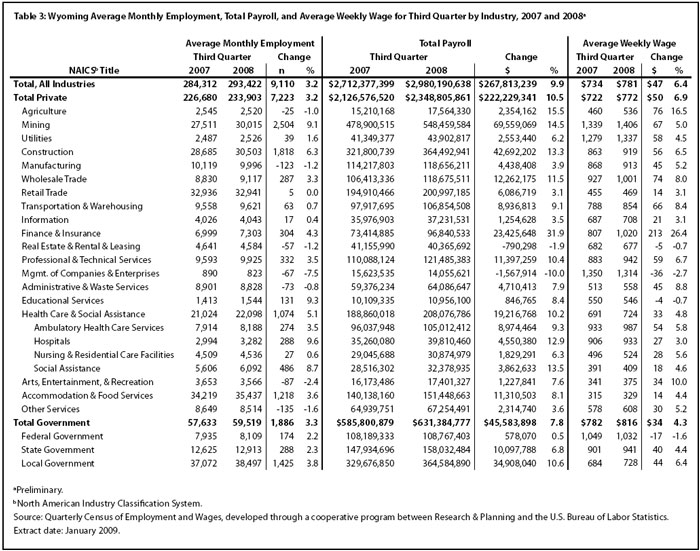
Table 3 shows that the sectors adding the most jobs in third quarter were mining (including oil & gas), construction, local government (including public schools, colleges, and hospitals), accommodation & food services, and health care & social assistance.
The mining sector added 2,504 jobs (9.1%) and its payroll increased by $69.6 million (14.5%). Support activities for mining (the subsector that includes drilling oil & gas wells) gained more than 1,450 jobs. Oil & gas extraction added more than 450 jobs, and mining (except oil & gas) added approximately 550 jobs. Generally, firms classified in oil & gas extraction own the oil and gas and make profits by selling oil and gas. These firms contract with drilling companies and oilfield service companies (classified in support activities for mining) to actually develop the resources.
Construction employment increased by 1,818 jobs (6.3%) and its total payroll rose by $42.7 million (13.3%). Employment fell slightly in construction of buildings, but rose rapidly in heavy & civil engineering construction (nearly 700 jobs) and specialty trade contractors (more than 1,150 jobs).
In third quarter 2008, local government employment rose by 1,425 jobs (3.8%) and its total payroll increased by $34.9 million (10.6%). Job growth in local government appears to have accelerated in 2007 and 2008, possibly as a result of increased tax revenues from energy development around the state. Approximately 550 jobs were added in public administration (including cities, towns, and counties). Educational services (including public schools and colleges) gained fewer than 400 jobs, while hospitals gained approximately 200 jobs. Employment in arts, entertainment, & recreation (including gambling) increased by more than 200 jobs.
Employment increased by 1,218 jobs (3.6%) and total payroll rose by $11.3 million (8.1%) in accommodation & food services. The job gains were approximately evenly split between accommodation and food services & drinking places.
Health care & social assistance added 1,074 jobs (5.1%) and total payroll increased by $19.2 million (10.2%). The largest job gains were found in social assistance (486 jobs, or 8.7%), but part of this increase was the result of a noneconomic code change (see related article for a discussion of noneconomic code changes) from a large employer in other services. The other services sector includes a broad range of firms, including car repair shops, laundry services, civic organizations, and private households. Strong growth was seen in private hospitals (288 jobs, or 9.6%) and ambulatory health care services (274 jobs, or 3.5%).
Job losses were seen in a number of sectors, including other services; manufacturing; arts, entertainment & recreation; and administrative & waste services.
Employment fell by 135 jobs (-1.6%) in other services, while total payroll increased by $2.3 million (3.6%). Job gains in repair & maintenance services and personal & laundry services were more than offset by losses in membership associations & organizations and private households. In a noneconomic code change, a large employer was moved from membership associations & organizations to social assistance.
Wyoming’s manufacturing sector lost 123 jobs (-1.2%) but its total payroll increased by $4.4 million (3.9%). It is possible that total payroll could have increased even as job counts decreased because fewer workers were putting in more hours and thereby earning overtime pay. Wood product manufacturing posted the largest job losses, and smaller job losses were seen in nonmetallic mineral product manufacturing, fabricated metal product manufacturing, and furniture & related product manufacturing.
Total payroll increased by $1.2 million (7.6%) in arts, entertainment, & recreation, but employment fell by 87 jobs (-2.4%). Employment grew slightly in museums, historical sites, zoos, & parks, but decreased in other parts of this sector.
Employment fell by 73 jobs (-0.8%) in administrative & waste services, but total payroll increased by $4.7 million (7.9%). Job gains in services to buildings & dwellings and waste management & remediation services were more than offset by job losses in employment services and business support services.
Employment and Wages by County
Table 4 shows that on an over-the-year basis, employment increased in 20 of Wyoming’s 23 counties. Growth in total payroll was even more widespread, with only one county showing a decrease. Many counties were affected by job growth in mining, construction, and local government. Natrona County, which had large job gains in health care & social assistance and accommodation & food service, was a notable exception.
Employment increased by 2,008 jobs (7.4%) and total payroll rose by $46.6 million (14.1%) in Campbell County. The largest job gains occurred in construction (more than 800 jobs) and mining (including oil & gas; approximately 650 jobs). Growth was also seen in wholesale trade, retail trade, transportation & warehousing, administrative & waste services, health care & social assistance, and accommodation & food services.
Sweetwater County’s employment rose by 1,074 jobs (4.3%) and its total payroll increased by $33.2 million (11.4%). The mining sector (including oil & gas) posted the largest job gains (more than 500 jobs), followed by construction (approximately 450 jobs), local government (more than 150 jobs), and transportation & warehousing (approximately 100 jobs). Employment decreased in retail trade and administrative & waste services.
Uinta County added 737 jobs (7.5%) in third quarter and its total payroll grew by $11.8 million (13.2%). Construction employment increased by more than 500 jobs. Other job gains were seen in local government (including public schools), transportation & warehousing, and accommodation & food services. Employment decreased slightly in real estate & rental & leasing and retail trade.
Fremont County gained 524 jobs (3.2%) and its total payroll increased by $12.6 million (9.7%). Local government (including public schools and colleges) added more than 300 jobs. Smaller job gains occurred in mining, wholesale trade, retail trade, and other services.
Employment increased by 469 jobs (9.4%) in Converse County and its total payroll grew by $10.7 million (23.9%). Construction added more than 250 jobs and mining (including oil & gas) added approximately 100 jobs.
Employment fell by 1,081 jobs (-14.2%) and total payroll decreased by $23.8 million (-28.6%) in Lincoln County. The construction sector lost approximately 1,100 jobs and $26.2 million in payroll. Some of this decrease in construction may have been related to the completion of a large project. Job gains were seen in mining (including oil & gas) and local government.
Total payroll in Carbon County rose by $4 million (5.6%), but employment fell by 88 jobs (-1.1%). More than 300 construction jobs were lost, but employment increased in many sectors, including mining, transportation & warehousing, information, professional & technical services, administrative & waste services, and accommodation & food services.
Platte County’s employment fell by 40 jobs (-1.2%) and its total payroll rose by $0.9 million (3.8%). Minor job losses were seen in several sectors, including mining, construction, manufacturing, wholesale trade, and retail trade.
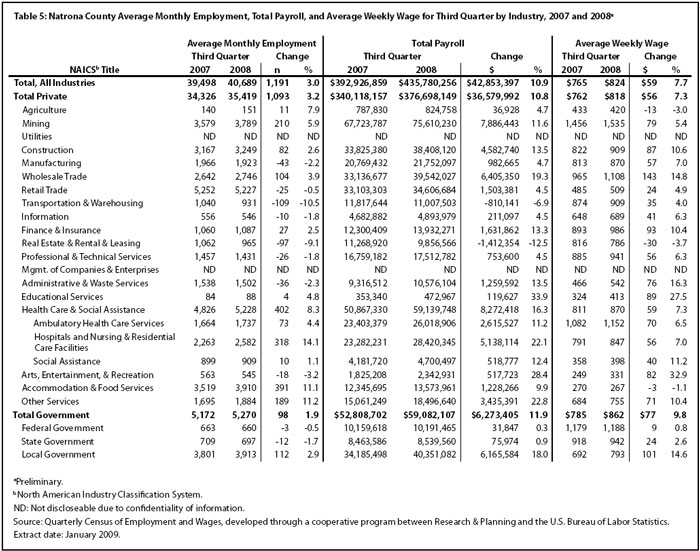
Natrona County added 1,191 jobs (3.0%) and its total payroll increased by $42.9 million (10.9%; see Table 5). Health care & social assistance gained 402 jobs (8.3%), with the largest part of that increase coming from hospitals and nursing & residential care facilities (318 jobs, or 14.1%). Other large job gains occurred in accommodation & food services (391 jobs, or 11.1%), mining (including oil & gas; 210 jobs, or 5.9%), other services (189 jobs, or 11.2%), and wholesale trade (104 jobs, or 3.9%). Job losses were seen in transportation & warehousing (-109 jobs, or -10.5%) and real estate & rental & leasing (-97 jobs, or -9.1%).
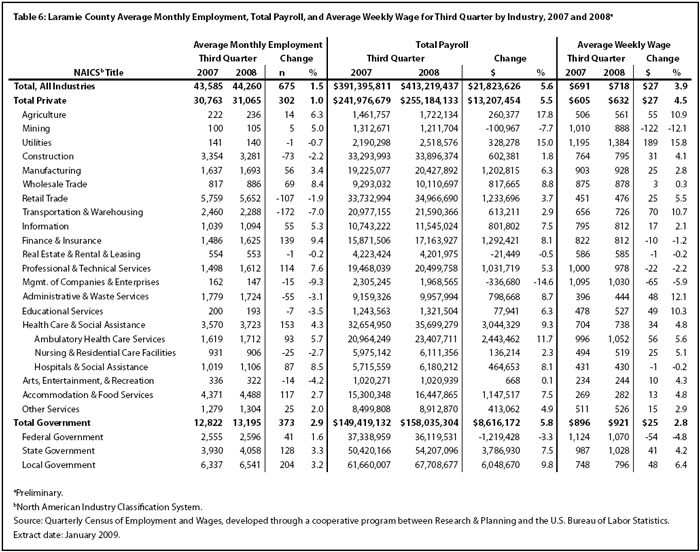
Table 6 shows that employment and wage growth was somewhat slower than the statewide average in Laramie County, which added 675 jobs (1.5%) and $21.8 million (5.6%) in total payroll. Local government (including public schools, colleges, and hospitals) added 204 jobs (3.2%) and its total payroll increased by $6 million (9.8%). Other large job gains were seen in health care & social assistance (153 jobs, or 4.3%), finance & insurance (139 jobs, or 9.4%), state government (128 jobs, or 3.3%), and accommodation & food services (117 jobs, or 2.7%). Employment fell in transportation & warehousing (-172 jobs, or -7.0%), retail trade (-107 jobs, or -1.9%), and construction (-73 jobs, or -2.2%).
In summary, growth in jobs and total payroll increased slightly from second quarter to third quarter 2008, but remained marginally below their five-year averages. Mining (including oil & gas) created the largest number of new jobs and growth was seen in most areas of the state.
References
Black, D. & Evans, M. (1997, May). Work, pay and consumer spending, part one: Sales tax collections and total payroll. Wyoming Labor Force Trends, 34(5), Retrieved September 11, 2008, from http://doe.state.wy.us/LMI/0597/0597a2.htm
U.S. Bureau of Economic Analysis. (2007, May 15). SA04 State income and employment summary – Wyoming. Retrieved May 15, 2007, from http://www.bea.gov/regional/spi/default.cfm
U.S. Census Bureau. (2007, August 28). 2007 NAICS codes and titles. Retrieved September 20, 2007, from http://www.census.gov/naics/2007/NAICOD07.HTM
Return to text
Return to text
Return to text
Return to text
Return to text
Return to text
Return to text
Last modified on
by Phil Ellsworth.