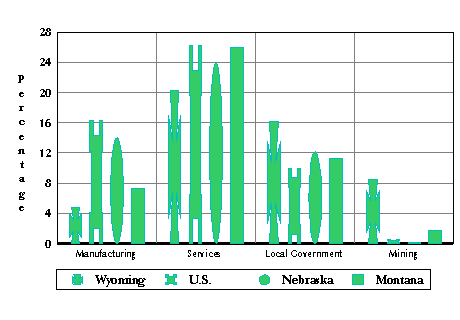
Figure: Percent of Covered Employment
by Major Industry Division, 1994

* Nebraska & Montana were used because they are neighboring states and have similar
population bases overall.
** The Figure shows the percentage of employment for the four industries in the four geographical areas.
| Back to |
Table of |
Labor Market |
Employment |
Comments on |
| Article |
Contents |
Information |
Resources |
TRENDS |
 |
 |
 |
 |
 |
|---|


