© Copyright 2005 by the Wyoming Department of Employment, Research & Planning
WYOMING LABOR FORCE TRENDS
Vol. 42 No. 3
Location Quotient Calculator: New BLS Web Tool Allows Local Area Comparisons
Adapted from the U.S. Bureau of Labor Statistics’ Location Quotient Calculator web page at
<http://www.bls.gov/cew/cewlq.htm>. Additional text and tables by
Krista R. Shinkle, Senior Economist, Wyoming Department of Employment, Research & Planning.
The Bureau of Labor Statistics (BLS) has added a powerful new tool for labor market analysis to its website services: the Location Quotient Calculator. The new calculator generates location quotients, a measure that is familiar to regional labor economists as a way to readily compare the industrial activity levels among different areas of the country. Location quotients are ratios typically used to compare the concentration of a resource or activity, such as employment, in a defined area to that of a larger area or base. For example, location quotients can be used to compare state employment by industry to that of the nation; or employment in a city, county, metropolitan statistical area (MSA), or other defined geographic sub-area to that of a state. The new BLS location quotient calculator uses a timely data source that is especially rich in comprehensive industry and area detail – BLS’s Quarterly Census of Employment and Wages (QCEW).
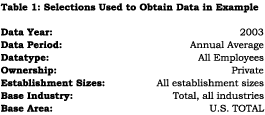
With just a few quick selections from the BLS Web form, the user can specify a base or reference area (usually the United States as a whole) and a base or reference industry (usually the private sector, all industries), where industries are classified on a North American Industry Classification System (NAICS) basis
(see Table 1). The user may choose up to three geographic areas to be compared to the base area and may choose numerous industries to be compared to the base industry. Users may choose standard industry lists, such as NAICS, or they may select any number of broad or narrowly defined NAICS industries for analysis. This innovative use of QCEW data allows for focused, detailed industry study at the desired geographic level.
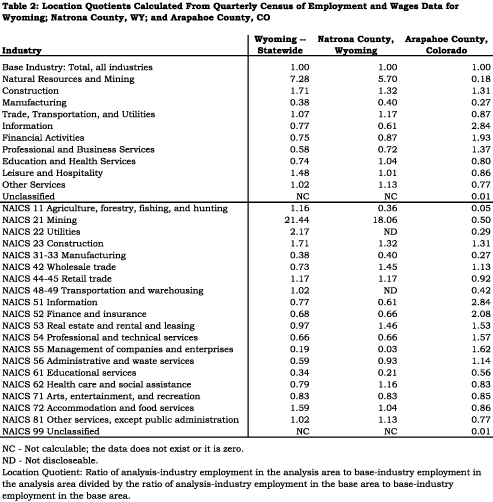
In our example (see Table 2), we chose three geographic areas (Wyoming; Natrona County, WY; and Arapahoe County, CO) with which to compare our base area (U.S., all industries). We also elected to compare the base industry (All Industries) to two sets of NAICS industries. The first is a customized list commonly used by Research & Planning that groups related NAICS codes to resolve confidentiality issues caused by small sample sizes. The second reflects standard NAICS codes.
Table 2 shows the Location Quotients results. Though not included here, employment and percentage of employment comparisons are also shown on the web page. Interpretations of the results show, for example, that even though both Natrona and Arapahoe counties are metropolitan areas, the dominant industry in Natrona County is Mining as opposed to the Information and Financial Activities industries seen in Arapahoe County.
The Location Quotient Calculator is available on the Bureau of Labor Statistics’ website at
<http://www.bls.gov/cew/cewlq.htm>.
Table of Contents | Labor Market Information | Wyoming Job Network | Send Us Mail
These pages
designed by Julie Barnish.
Last modified on
by Susan J. Murray.