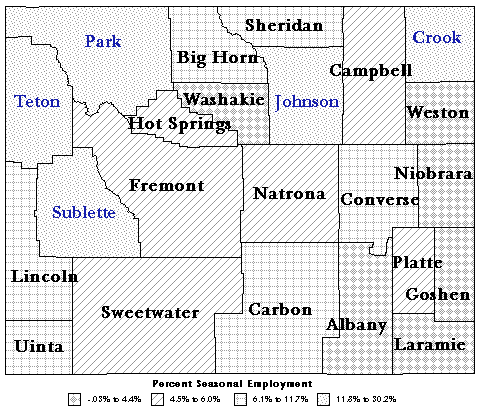
Map: Percent of Seasonal Employment Change by County, First Quarter 1997 to Third Quarter 1997
Counties in colored text are those that have the highest percent change in employment.
Source: Wyoming 1997 Annual Covered Employment and Wages.
Map created on Atlas Geographic Information Systems (GIS) by © Environmental Systems Research Institute, Incorporated (ESRI).
Seasonal Variation of Employment | Table of Contents | Labor Market Information | Employment Resources | Send Us Mail
These pages designed by Gayle C. Edlin.
Last modified on
by
Gayle C. Edlin.