© Copyright 2007 by the Wyoming Department of Employment, Research & Planning
Vol. 44 No. 2
A record number of new businesses formed in Wyoming in 2004 and 2005. New Mining firms in 2005 created more than double the number of jobs compared to three years ago, and total wages nearly tripled. This fast growth may have stimulated growth in other related industries such as Professional & Technical Services and Real Estate & Rental & Leasing.
New business formation and the speed of business formation are important indices of economic growth. They also represent sources for future jobs, wages, and tax revenues for the state and its communities. Changes in distribution of new businesses among industries may also indicate new directions of economic expansion.
Wyomingĺs economy experienced a fast recovery after the slowdown of 2002 and 2003, when employment growth was under 1%, and Unemployment Insurance claims and benefits paid reached a decade high (Wen 2003). During 2004 and 2005, the state entered a new economic expansion as oil and gas prices surged nationally and worldwide. In 2005, state annual average employment grew by 8,107 jobs or 3.3% while total wages grew by $717 million or 9.3%. These are both decade highs (see Figure 1). This research examines new business formation during this economic expansion period in Wyoming.
Methodology
A new business for the purposes of this article refers to a previously non-existent business that actively provides goods or services and has employees (Wen, 2005). New branches of existing firms or reopened firms that were closed temporarily were not considered as new firms. Also not counted were firms registered with the Department of Employmentĺs Unemployment Tax Division (UTD) as new starts but which never had employment nor reported wages paid.
By law, a new employer must register with the UTD to indicate the type of business, the location, and other related information. The UTD will then set up a new, unique Unemployment Insurance (UI) account for the firm.
Research & Planning (R&P) of UTD manages the monthly database of new business registrations. However, some registered firms are unable to open on time and some eventually decide not to open at all. The new registration database does not distinguish which firms actually opened for business or the exact starting time. To address this problem, we matched the database with the Quarterly Census of Employment and Wages (QCEW) which is an administrative database containing employment and wage information from firmsĺ quarterly UI tax reports. When a new firm opened for business in a specific quarter, that quarterĺs QCEW database showed how many employees were hired and the wages it paid during the quarter. From this matching process, we identified the new active firms.
Business formation rates were defined as the number of new firms divided by the total number of firms. Initial jobs were defined as the highest average quarterly employment during the first two quarters a firm is in business.
R&P has tracked Wyomingĺs new business formation and published related research biannually since 1995. This research focused on 2005 data, with 2004 data included in most of the tables and figures for comparison purposes.
Business Formation
In 2004 and 2005, a total of 2,095 and 2,218 new firms, respectively, opened for business in Wyoming, both record highs. The business formation rate in 2004 was 9.3%, and in 2005 was 9.6%. New firms provided 7,701 initial jobs in 2004 and 9,333 jobs in 2005 (see Table 1), accounting for 3.1% and 3.7% of the stateĺs average employment in 2004 and 2005, respectively. New firms also contributed $106 million in associated total wages in 2004 and $151 million in 2005, equal to 1.4% and 1.8% of state total wages for these two years, respectively.
Among the stateĺs five regions, the Southwest region attracted the most new firms (598 or 27%) in 2005, followed by the Southeast region with 497 firms (22.4%) and the Central region with 370 firms (16.7%). The associated jobs were distributed similarly to the firmsĺ distribution among regions. Of the 9,333 jobs new firms added, 26.0% were in the Southwest region. The Southeast region had 20.9% of the jobs, while the Central region accounted for 19.3%.
While firms and job growth were distributed similarly, the associated wages were not. The Southwest region led the state with $39 million (26.0%) while the Northwest region was at the bottom with $14 million (9.3%). However, both the Central region (with $32 million, or 21.2%) and the Northeast region (with $27 million, or 18.1%) had wages greater than the Southeast region ($25 million, or 16.7%). This suggests that the proportion of job growth in high-paying occupations in each region varies significantly.
Figure 2 shows the Northeast region was the fastest growth region in 2005 with an average employment increase of 5.8%, followed by the Southwest region with 4.6%. The statewide gain on average employment was 3.3% for the year. Using the annual average wage as an index of labor demand, Northeast and Southwest also were ranked as the top two regions with the highest labor demand. Their average wages were $36,195 and $36,269 in 2005, respectively, compared with the statewide average of $33,091. Why did the Northeast region, one of the top two fastest growth regions, gain the fewest number of new firms in 2005 among all five regions? One possible explanation is that the new firms located in this region were relatively large firms compared to new firms in other regions, and averaged five initial employees (see Table 1). Another explanation could be that this regionĺs fast growth was mainly dependent upon existing firmsĺ expansion. This is quite different from other regions. If there is an economic downturn, the Northeast region is more likely to experience more contraction in existing firms as a consequence rather than the closure of firms.
In 2005, Laramie County gained the most new firms and jobs (311 and 1,304, respectively). Natrona County was second for firm and job growth, with 254 new firms and 1,263 jobs. However, firms located in Natrona County had higher total wages ($23.1 million) than Laramie County ($19.5 million). Teton County obtained 221 new firms, ranking third, but gained only 595 associated initial jobs which generated $12.8 million in wages. Teton Countyĺs job and wage gains were both less than Campbell Countyĺs gains (777 jobs and $14.8 million), even though Campbell had roughly half as many new firms as Teton County.
Campbell and Sweetwater counties had the highest annual average wage in 2005, $42,757 and $42,080, respectively, which indicated a large labor demand. These counties also had most of the job gains in 2005. Campbell County gained 1,793 jobs (an 8.4% increase) over the previous year and Sweetwater County gained 1,418 jobs (a 6.9% increase). However, new business formation in these two counties seemed to be disproportionate to their labor demand level and job growth speed; only 126 and 174 new firms were established in 2005 in Campbell and Sweetwater counties, respectively. This indicates the fast growth in Campbell and Sweetwater counties came mainly from expansion of existing firms.
The Construction industry attracted the largest number of new firms, 467 or 21.1% (See Table 2). Professional & Technical Services was second, with 277 (12.5%) new firms. The top three job contributors were Construction (2,050 jobs); Accommodation & Food Services (1,564 jobs); and Health Care & Social Assistance (853 jobs). Construction firms also added the most wages among new businesses, with $32.7 million in total payroll, followed by Mining ($23 million) and Health Care & Social Assistance ($18.5 million).
Over the past four years, new firm creation in Mining was slow but steady, from 86 new startups in 2002 to 106 in 2005. At the same time, the associated jobs and wages grew much faster. The number of jobs created in 2005 (746) was more than double the number in 2002 (299), and wages in 2005 for new firms were nearly triple that of new firms in 2002 ($23 million compared to $8.3 million). Mining was the fourth largest job provider and the second largest wage contributor among all new firms in 2005. The fast growth of new mining jobs may have stimulated other related industriesĺ growth. For example, jobs related to new firms in Professional & Technical Services grew by 50.4%, from 375 jobs in 2002 to 564 jobs in 2005. New jobs in Real Estate & Rental & Leasing grew by 89.5% from 143 jobs in 2002 to 271 jobs in 2005.
Business Survival
Both external and internal factors can affect a firmĺs likelihood of survival. External influencing factors include market demand for the specific product or service that the firm engaged in; similar business competitions; related government policies; available labor supply; and business location. However, business closures in some cases may be more related to internal factors. Some examples could include a firm lacking the financial ability to maintain its day-to-day operation; an ownerĺs health situation or desire to retire; or a change in the ownerĺs personal interests. New firms that can identify those business areas in which firms closed due to internal factors may be more efficient, competitive, and more likely to survive because the demand for those special products or services is still there. Accurate business targeting can meet local community demand and make the local economy more efficient and diversified. Local economic development agencies may be helpful in identifying those needs for potential new employers.
Wyoming was ranked third in 2006 among the 50 states and District of Columbia for having a policy environment that increases the chances for survival of new businesses according to the Small Business Survival Index provided by the Small Business & Entrepreneurship Council (Keating, 2006). R&P assessed Wyoming business survival by tracking all of the firms that started businesses between fourth quarter 1992 and first quarter 2005.
R&P can observe the survival of a business under its original owner due to the availability of information on business changes (selling, merging, splitting, etc.). A firm still reporting its employment and wage information to the Unemployment Insurance Tax Division one year after its inception is considered to have survived one year. The same methods are used to define two-year survival, three-year survival, and so on. The one-year survival rate is the number of one-year survivals divided by the number of new businesses started one year ago. The two-year survival rate is the number of two-year survivals divided by the number of new businesses started two years ago. The same method is applied to other multiple-year survival rates.
More than two-thirds (68.6%) of the new firms in Wyoming survived one year in business (see Table 3). More than one-half (54.2%) survived two years. As a general rule, the survival rate decreases as the years increase. Only 32.5% of new firms were in business five years after their start-up.
New firms located in the Northeast region had the highest survival rates for the first three years, 70.8% for the first year, 55.8% for the second year, and 46.0% for the third year. New firms in the Central region did the second best. Among the three counties which attracted the most new businesses (Laramie, Natrona, and Teton), Natrona had the best survival rates for the new firms with 71.1% that survived one year, 56.4% that survived two years, and 45.7% that survived three years.
Among private industries (see Figure 3 and Table 4), firms engaged in Health Care & Social Assistance had the best one-year survival rates (82.1%), followed by firms in Management of Companies & Enterprises (79.3%) and Real Estate & Rental & Leasing (76.7%). The Construction industry has historically had the largest percentage of new firms (21.1% in 2005). However, firms in this industry had the poorest survival rate. Only 56.9% were active after one year in business. This likely is a consequence of these firmsĺ dependence on temporary construction projects.
Overall, new firms in Management of Companies & Enterprises had the best survival rate over time. After 10 years in business, 47.4% of firms were still active, although both the number of new firms and their associated initial jobs were limited. Among the top three job providers related to new firms (Construction, Accommodation & Food Services, and Health Care & Social Assistance) in 2005, Health Care & Social Assistance showed the best survival rates over the years. About 25.5% of firms in this industry were still active after 10 years in business, while only 18.1% of firms in Accommodation & Food Services and 12.2% of firms in Construction survived after 10 years.
Summary
In 2004, 2,095 new firms started businesses in Wyoming, providing 7,701 associated initial jobs and $106 million in associated total wages. In 2005, those numbers rose to 2,218 new firms, 9,333 associated new jobs, and $151 million in wages. The Southwest, Southeast, and Central regions were the top three locations for new firms. Keeping with the historical trend, the Construction industry opened the largest percentage of new firms in these two years, but had the lowest one-year survival rate. The number of new firms in Mining industry increased steadily over the years at a slow pace, but their associated new jobs and wages were double or triple compared to three years ago. Health Care & Social Assistance firms had the best one-year survival rate among private industries.
References
Wen, S. (2003). Wyoming unemployment insurance claims and benefit payments reach 10-year high in fiscal year 2003. Wyoming Labor Force Trends 40(9). Retrieved March 5, 2007 from http://doe.state.wy.us/lmi/0903/a1.htm
Wen, S. (2005). New firms, new directions: Business formation in Wyoming. Wyoming Labor Force Trends 42(1). Retrieved March 7, 2007 from http://doe.state.wy.us/lmi/0105/a1.htm
Keating, R.(2006, October). Small Business Survival Index 2006. Retrieved January 23, 2007, from http://sbecouncil.org/Media/pdf/SBSI_2006.pdf
Return to text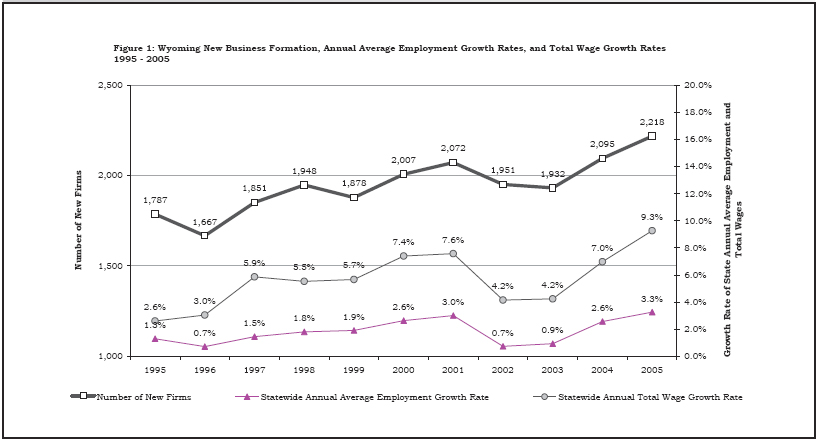
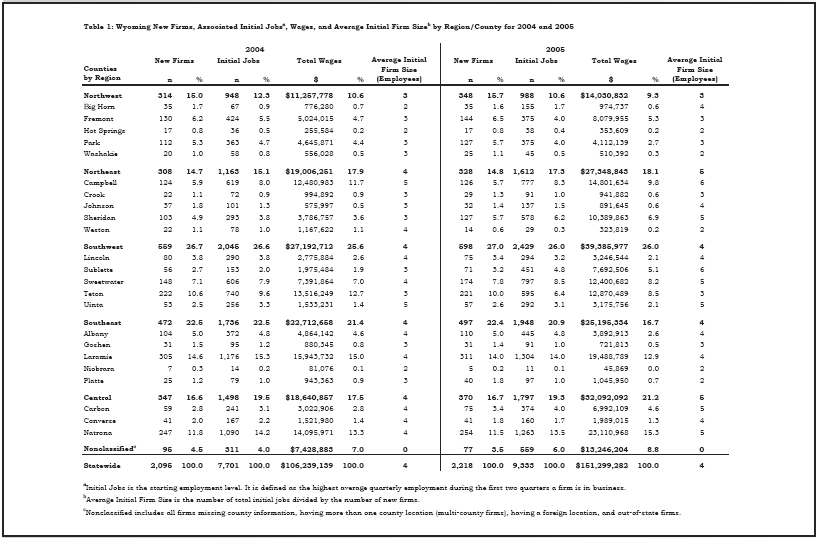
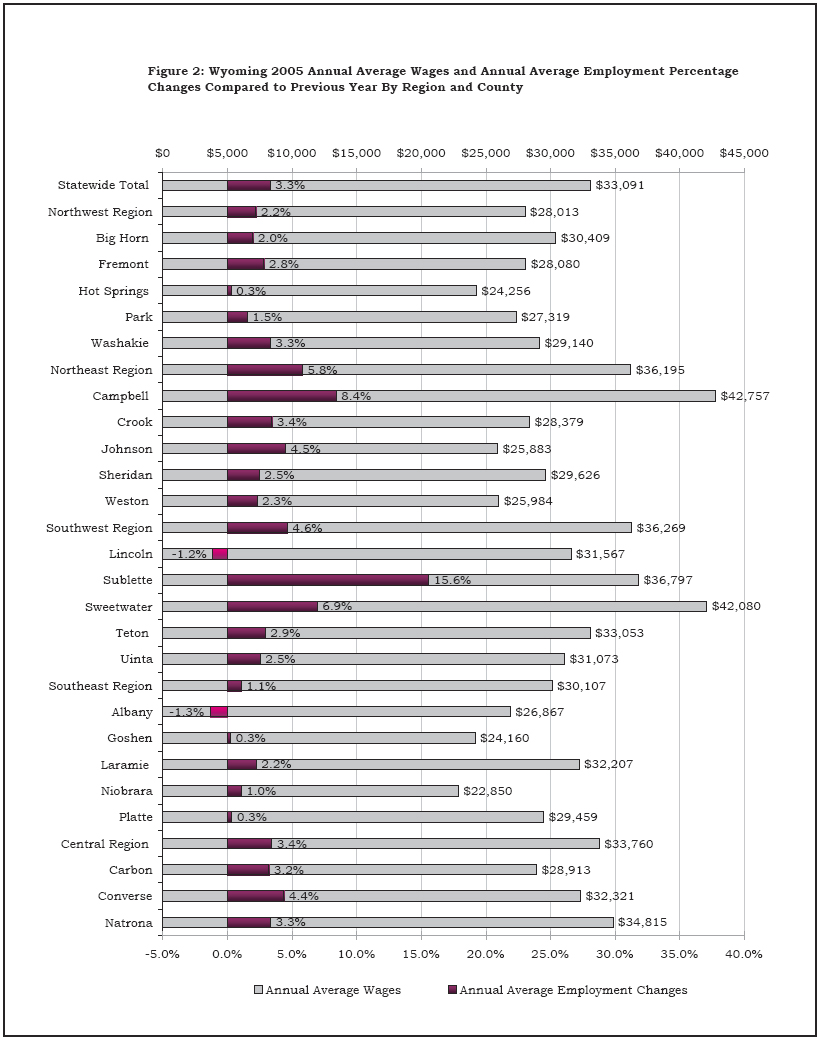
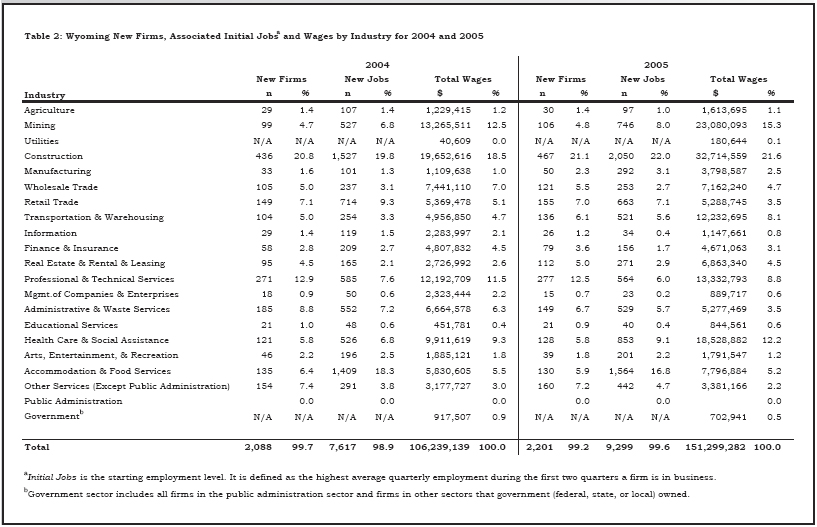
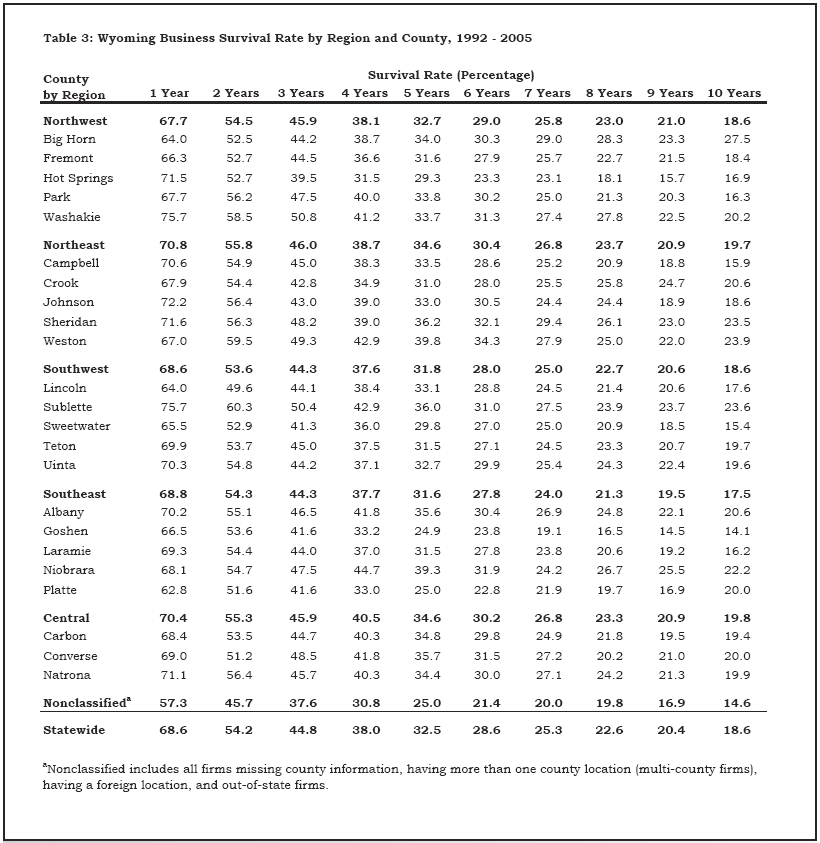
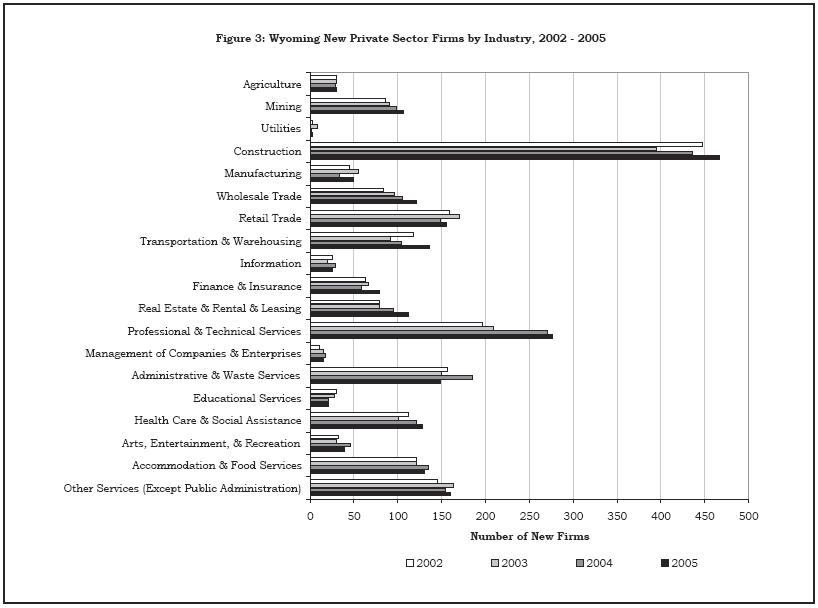
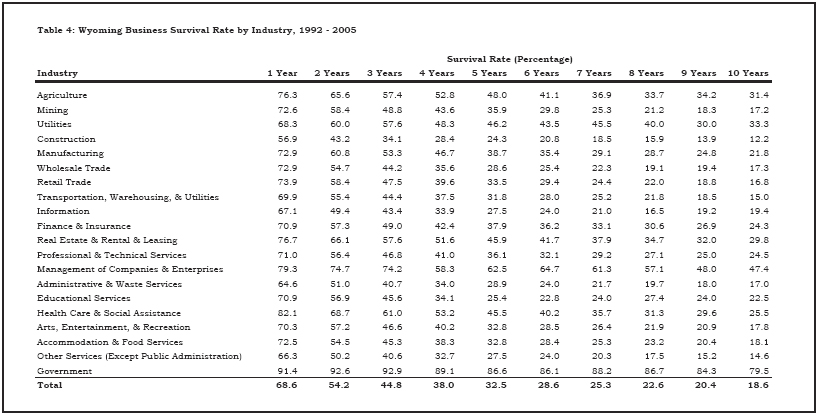
Table of Contents | Labor Market Information | Wyoming
at Work | Send Us Mail
Last modified on
by Phil Ellsworth.