Technology Jobs in Wyoming, 2003 to 2013
The Research & Planning section of the Wyoming Department of Workforce Services publishes a quarterly report generated from data from the Quarterly Census of Employment and Wages (QCEW) on its Labor Market Information (LMI) website. The information gathered for this report is based on establishments, employment, total payroll, and average weekly wage data on 44 national industry codes from the North American Industry Classification System (NAICS) related to technology. This information is accessible through the quarterly report on QCEW Summary Statistics by Industry Technology-Related.
Based on all the information provided, a question must be posed: Are technology industries becoming a greater portion of Wyoming employment, relating to wages, establishments, and total payroll?
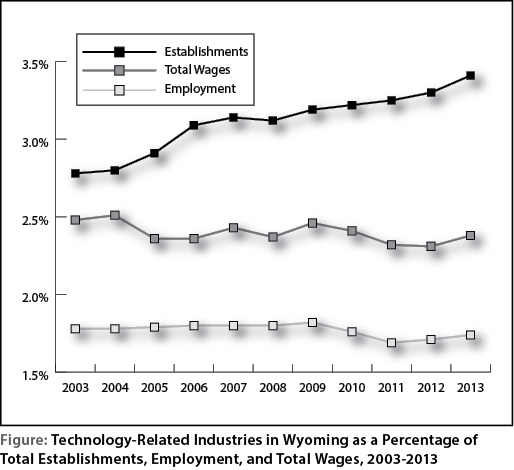
As shown in the Table and the Figure, the percentage of technology-related industries, in comparison to the overall totals, remains consistent. This information is based on the annual employment, establishments, and total wages from 2003 to 2013. In regards to establishments, the percentage of technology-related industries slightly increased each year, from 2.8% (608 establishments) in 2003 to 3.4% (870 establishments) in 2013, with a 10-year average of 3.1%. Wages in technology-related industries remained relatively constant as a percentage of total wages from 2003 to 2013, from 2.3% in 2012 to 2.5% in 2004, with a 10-year average of 2.4%.
The average annual employment in technology ranged from 1.8% (4,307) in 2003 to 1.7% (4,858) in 2013. Percentage of employment technology shares ranged from a low of 1.7% (4,650) in 2011 to a high of 1.8% (5,002) in 2009, with a 10-year average of 1.8%. Based on the low of 4,307 jobs (1.8%) in 2003 to a high of 5,156 jobs (1.8%) in 2008 with a 10-year average of 4,753 technology jobs (1.8%), it can be concluded that employment in technology has followed the same economic cycles as the state of Wyoming during the same time period.
In summary, technology-related industry employment remained consistent at 1.8% with regard to Wyoming’s overall employment from 2003 to 2013.
| Establishments | Avg. Annual Employment | Total Wages | Average Annual Wage | |||||||||
|---|---|---|---|---|---|---|---|---|---|---|---|---|
| Year | Total | Tech N | Tech % | Total | Tech N | Tech % | Total | Tech $ | Tech % | Total | Tech $ | Tech % |
| 2003 | 21,858 | 608 | 2.8% | 241,882 | 4,307 | 1.8% | $7,237,793,819 | $179,849,837 | 2.5% | $29,923 | $41,754 | 139.5% |
| 2004 | 22,416 | 627 | 2.8% | 248,068 | 4,410 | 1.8% | $7,742,843,070 | $194,270,504 | 2.5% | $31,213 | $44,057 | 141.2% |
| 2005 | 23,030 | 670 | 2.9% | 254,421 | 4,553 | 1.8% | $8,459,687,194 | $199,613,154 | 2.4% | $33,251 | $43,842 | 131.9% |
| 2006 | 23,873 | 738 | 3.1% | 266,897 | 4,796 | 1.8% | $9,785,013,512 | $231,368,891 | 2.4% | $36,662 | $48,242 | 131.6% |
| 2007 | 24,456 | 769 | 3.1% | 277,741 | 4,997 | 1.8% | $10,901,998,034 | $264,431,186 | 2.4% | $39,252 | $52,919 | 134.8% |
| 2008 | 25,019 | 780 | 3.1% | 286,337 | 5,156 | 1.8% | $11,879,231,834 | $281,952,397 | 2.4% | $41,487 | $54,684 | 131.8% |
| 2009 | 25,056 | 800 | 3.2% | 274,760 | 5,002 | 1.8% | $11,185,206,664 | $275,237,746 | 2.5% | $40,709 | $55,023 | 135.2% |
| 2010 | 24,996 | 804 | 3.2% | 271,144 | 4,785 | 1.8% | $11,384,171,196 | $274,473,098 | 2.4% | $41,986 | $57,358 | 136.6% |
| 2011 | 25,096 | 815 | 3.2% | 274,743 | 4,650 | 1.7% | $11,922,224,011 | $276,888,843 | 2.3% | $43,394 | $59,546 | 137.2% |
| 2012 | 25,412 | 839 | 3.3% | 278,595 | 4,768 | 1.7% | $12,419,640,108 | $286,752,519 | 2.3% | $44,580 | $60,141 | 134.9% |
| 2013 | 25,517 | 870 | 3.4% | 279,689 | 4,858 | 1.7% | $12,579,388,156 | $299,898,897 | 2.4% | $44,976 | $61,733 | 137.3% |
| Source: Quarterly Census of Employment and Wages (QCEW). | ||||||||||||