Continued
Claims |
Claims Filed
|
% Change
Claims Filed |
Jul
15 |
Jul
15 |
Jul
15 |
Jun
15 |
Jul
14 |
Jun
15 |
Jul
14 |
|
Wyoming Statewide
|
|
|
|
|
|
|
TOTAL WEEKS CLAIMED
|
20,274
|
22,293
|
12,200
|
-9.1
|
66.2
|
|
TOTAL UNIQUE CLAIMANTS |
4,824
|
6,431
|
2,990
|
-25.0
|
61.3
|
|
Benefit Exhaustions
|
419
|
346
|
263
|
21.1
|
59.3
|
|
Benefit Exhaustion Rates
|
8.7%
|
5.4%
|
8.8%
|
3.3%
|
-0.1%
|
|
|
|
|
|
|
|
|
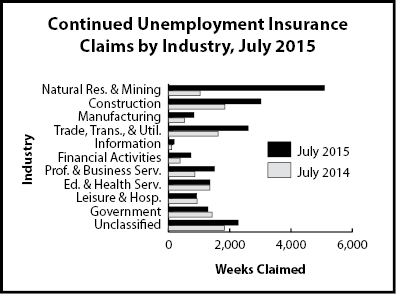
TOTAL GOODS-PRODUCING
|
8,929
|
10,568
|
3,380
|
-15.5
|
164.2
|
|
Natural Res. & Mining
|
5,089
|
5,898
|
1,027
|
-13.7
|
395.5
|
|
Mining
|
5,015
|
5,778
|
950
|
-13.2
|
427.9
|
|
Oil & Gas Extraction
|
474
|
480
|
92
|
-1.3
|
415.2
|
|
Construction
|
3,016
|
3,712
|
1,835
|
-18.8
|
64.4
|
|
Manufacturing
|
822
|
956
|
517
|
-14.0
|
59.0
|
|
TOTAL SERVICE-PROVIDING
|
7,794
|
8,329
|
5,573
|
-6.4
|
39.9
|
|
Trade, Transp., & Utilities
|
2,601
|
2,715
|
1,620
|
-4.2
|
60.6
|
|
Wholesale Trade
|
766
|
716
|
317
|
7.0
|
141.6
|
|
Retail Trade
|
783
|
819
|
841
|
-4.4
|
-6.9
|
|
Transp., Warehousing & Utilities
|
1,052
|
1,180
|
462
|
-10.8
|
127.7
|
|
Information
|
182
|
203
|
100
|
-10.3
|
82.0
|
|
Financial Activities
|
729
|
719
|
376
|
1.4
|
93.9
|
|
Prof. & Business Services
|
1,491
|
1,643
|
858
|
-9.3
|
73.8
|
|
Educational & Health Svcs.
|
1,351
|
1,123
|
1,345
|
20.3
|
0.4
|
|
Leisure and Hospitality
|
912
|
1,330
|
933
|
-31.4
|
-2.3
|
|
Other Svcs., exc. Public Admin.
|
521
|
587
|
332
|
-11.2
|
56.9
|
|
TOTAL GOVERNMENT
|
1,283
|
1,133
|
1,421
|
13.2
|
-9.7
|
|
Federal Government
|
219
|
235
|
290
|
-6.8
|
-24.5
|
|
State Government
|
202
|
206
|
202
|
-1.9
|
0.0
|
|
Local Government
|
860
|
690
|
929
|
24.6
|
-7.4
|
|
Local Education
|
269
|
173
|
245
|
55.5
|
9.8
|
|
UNCLASSIFIED
|
2,268
|
2,261
|
1,823
|
0.3
|
24.4
|
|
|
|
|
|
|
|
|
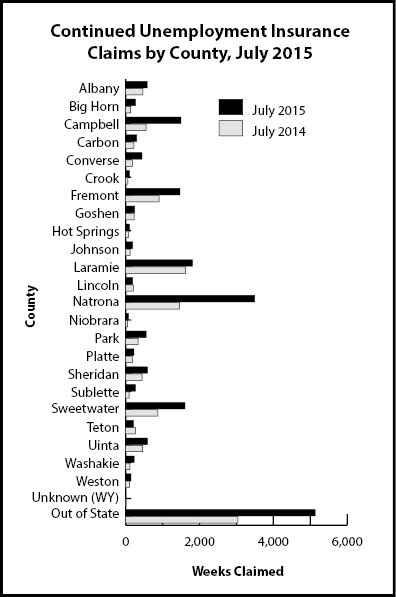
Laramie County
|
|
|
|
|
|
|
TOTAL WEEKS CLAIMED
|
1,806
|
2,028
|
1,625
|
-10.9
|
11.1
|
|
TOTAL UNIQUE CLAIMANTS
|
445
|
609
|
407
|
-26.9
|
9.3
|
|
|
|
|
|
|
|
|
TOTAL GOODS-PRODUCING
|
432
|
613
|
297
|
-29.5
|
45.5
|
|
Construction
|
264
|
375
|
189
|
-29.6
|
39.7
|
|
TOTAL SERVICE-PROVIDING
|
1,053
|
1,109
|
1,056
|
-5.0
|
-0.3
|
|
Trade, Transp., and Utilities
|
328
|
340
|
353
|
-3.5
|
-7.1
|
|
Financial Activities
|
87
|
82
|
102
|
6.1
|
-14.7
|
|
Prof. & Business Svcs.
|
280
|
288
|
236
|
-2.8
|
18.6
|
|
Educational and Health Svcs.
|
240
|
249
|
254
|
-3.6
|
-5.5
|
|
Leisure & Hospitality
|
90
|
114
|
113
|
-21.1
|
-20.4
|
|
TOTAL GOVERNMENT
|
209
|
195
|
209
|
7.2
|
0.0
|
|
UNCLASSIFIED
|
111
|
109
|
62
|
1.8
|
79.0
|
|
|
|
|
|
|
|
|
Natrona County
|
|
|
|
|
|
|
TOTAL WEEKS CLAIMED
|
3,494
|
3,873
|
1,460
|
-9.8
|
139.3
|
|
TOTAL UNIQUE CLAIMANTS
|
815
|
1,093
|
364
|
-25.4
|
123.9
|
|
|
|
|
|
|
|
|
TOTAL GOODS-PRODUCING
|
1,764
|
2,019
|
478
|
-12.6
|
269.0
|
|
Construction
|
349
|
441
|
144
|
-20.9
|
142.4
|
|
TOTAL SERVICE-PROVIDING
|
1,576
|
1,652
|
898
|
-4.6
|
75.5
|
|
Trade, Transp., and Utilities
|
578
|
636
|
236
|
-9.1
|
144.9
|
|
Financial Activities
|
159
|
165
|
63
|
-3.6
|
152.4
|
|
Professional & Business Svcs.
|
466
|
544
|
221
|
-14.3
|
110.9
|
|
Educational & Health Svcs.
|
214
|
199
|
283
|
7.5
|
-24.4
|
|
Leisure & Hospitality
|
126
|
116
|
105
|
8.6
|
20.0
|
|
TOTAL GOVERNMENT
|
71
|
82
|
41
|
-13.4
|
73.2
|
|
UNCLASSIFIED
|
83
|
117
|
40
|
-29.1
|
107.5
|