
Wyoming Occupational Fatalities Decrease to 26 in 2013
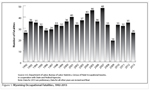 |
The Research & Planning (R&P) section of the Wyoming Department of Workforce Services has reported that the number of occupational fatalities fell from 35 in 2012 to 26 in 2013, a decrease of nine deaths (-25.7%; see Figure 1). On average, from 1992-2013 there were 34 occupational fatalities each year. Variations in fatalities from year to year are to some extent the result of the random nature of work-related accidents. Furthermore, there is not always a direct relationship between workplace fatalities and workplace safety. For example, suicides and homicides that occur in the workplace are included as occupational fatalities. In other cases, a sudden illness may be nearly coincidental with an accident that results in a workplace fatality. Occupational fatalities are counted in the state where the injury occurred, not necessarily the state of residence or the state of death.
The fatality counts featured in this release are compiled by the Census of Fatal Occupational Injuries (CFOI) program (a joint effort of R&P and the Bureau of Labor Statistics or BLS) and may not match those from other programs, such as the Occupational Safety and Health Administration (OSHA) because of differences in scope and methodology. In addition to regular wage and salary employees, CFOI counts include volunteer workers and self-employed individuals. The CFOI program utilizes a wide variety of data sources, such as OSHA reports, workers’ compensation data, vital records, coroner’s reports, media reports, and police reports of vehicle crashes. Additionally, similar data sources from other states are routinely used to identify workplace fatalities. For example, a worker fatally injured in a highway incident in Wyoming may be covered by workers’ compensation in another state. That information is made available to R&P as part of data sharing agreements between the states and federal government (BLS).
 |
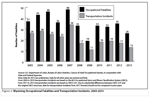 |
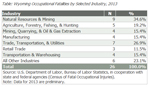
In 2013, the largest number of deaths occurred in natural resources & mining (nine, or 34.6% of all deaths; see Table). Within that category, five deaths were in agriculture (19.2%) and four deaths (15.4%) were in mining (including oil & gas). Four deaths occurred in manufacturing (15.4%), four deaths in transportation & warehousing (15.4%), and three in retail trade (11.5%). Half (50.0%) of workplace fatalities were the result of transportation incidents (see Figure 2).
From 2003-2013, transportation incidents made up 59.5% of all workplace deaths. Transportation incidents include highway crashes as well as incidents involving aircraft and other vehicles.
For official definitions used in the CFOI program, please visit http://stats.bls.gov/iif/oshcfdef.htm.