|
Continued Claims
|
Claims Filed
|
% Change
Claims Filed |
Jun
15 |
Jun
15 |
Jun
15 |
May
15 |
Jun
14 |
May
15 |
Jun
14 |
|
Wyoming Statewide
|
|
|
|
|
|
|
TOTAL WEEKS CLAIMED
|
22,293
|
23,423
|
13,312
|
-4.8
|
67.5
|
| TOTAL UNIQUE CLAIMANTS
|
6,431
|
6,843
|
3,982
|
-6.0
|
61.5
|
|
Benefit Exhaustions
|
346
|
339
|
320
|
2.1
|
8.1
|
|
Benefit Exhaustion Rates
|
5.4%
|
5.0%
|
8.0%
|
0.4%
|
-2.7%
|
|
|
|
|
|
|
|
|
TOTAL GOODS-PRODUCING
|
10,568
|
10,634
|
4,095
|
-0.6
|
158.1
|
|
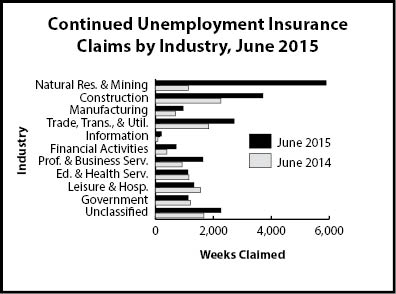
Natural Res. & Mining
|
5,898
|
5,972
|
1,139
|
-1.2
|
417.8
|
|
Mining
|
5,778
|
5,863
|
1,029
|
-1.4
|
461.5
|
|
Oil & Gas Extraction
|
480
|
516
|
88
|
-7.0
|
445.5
|
|
Construction
|
3,712
|
3,744
|
2,261
|
-0.9
|
64.2
|
|
Manufacturing
|
956
|
916
|
693
|
4.4
|
38.0
|
|
TOTAL SERVICE-PROVIDING
|
8,329
|
9,383
|
6,336
|
-11.2
|
31.5
|
|
Trade, Transp., & Utilities
|
2,715
|
2,887
|
1,839
|
-6.0
|
47.6
|
|
Wholesale Trade
|
716
|
670
|
320
|
6.9
|
123.8
|
|
Retail Trade
|
819
|
912
|
958
|
-10.2
|
-14.5
|
|
Transp., Warehousing & Utilities
|
1,180
|
1,305
|
561
|
-9.6
|
110.3
|
|
Information
|
203
|
156
|
89
|
30.1
|
128.1
|
|
Financial Activities
|
719
|
783
|
392
|
-8.2
|
83.4
|
|
Prof. & Business Services
|
1,643
|
1,667
|
926
|
-1.4
|
77.4
|
|
Educational & Health Svcs.
|
1,123
|
798
|
1,153
|
40.7
|
-2.6
|
|
Leisure and Hospitality
|
1,330
|
2,542
|
1,557
|
-47.7
|
-14.6
|
|
Other Svcs., exc. Public Admin.
|
587
|
543
|
374
|
8.1
|
57.0
|
|
TOTAL GOVERNMENT
|
1,133
|
1,144
|
1,209
|
-1.0
|
-6.3
|
|
Federal Government
|
235
|
361
|
305
|
-34.9
|
-23.0
|
|
State Government
|
206
|
231
|
187
|
-10.8
|
10.2
|
|
Local Government
|
690
|
550
|
716
|
25.5
|
-3.6
|
|
Local Education
|
173
|
84
|
139
|
106.0
|
24.5
|
|
UNCLASSIFIED
|
2,261
|
2,261
|
1,671
|
0.0
|
35.3
|
|
|
|
|
|
|
|
|
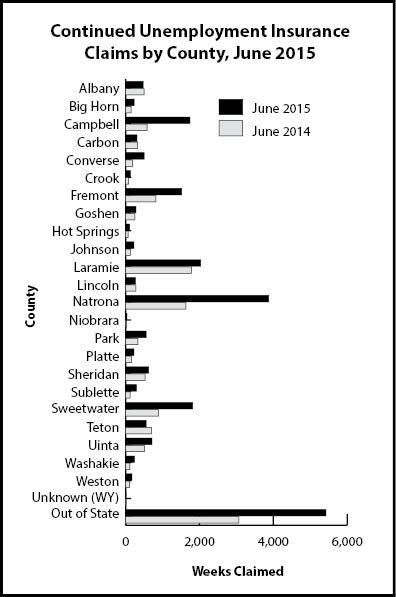
Laramie County
|
|
|
|
|
|
|
TOTAL WEEKS CLAIMED
|
2,028
|
1,843
|
1,781
|
10.0
|
13.9
|
|
TOTAL UNIQUE CLAIMANTS
|
609
|
573
|
516
|
6.3
|
18.0
|
|
|
|
|
|
|
|
|
TOTAL GOODS-PRODUCING
|
613
|
538
|
387
|
13.9
|
58.4
|
|
Construction
|
375
|
312
|
263
|
20.2
|
42.6
|
|
TOTAL SERVICE-PROVIDING
|
1,109
|
1,040
|
1,156
|
6.6
|
-4.1
|
|
Trade, Transp., and Utilities
|
340
|
360
|
396
|
-5.6
|
-14.1
|
|
Financial Activities
|
82
|
97
|
105
|
-15.5
|
-21.9
|
|
Prof. & Business Svcs.
|
288
|
288
|
279
|
0.0
|
3.2
|
|
Educational and Health Svcs.
|
249
|
170
|
256
|
46.5
|
-2.7
|
|
Leisure & Hospitality
|
114
|
113
|
135
|
0.9
|
-15.6
|
|
TOTAL GOVERNMENT
|
195
|
186
|
192
|
4.8
|
1.6
|
|
UNCLASSIFIED
|
109
|
79
|
45
|
38.0
|
142.2
|
|
|
|
|
|
|
|
|
Natrona County
|
|
|
|
|
|
|
TOTAL WEEKS CLAIMED
|
3,873
|
3,694
|
1,628
|
4.8
|
137.9
|
|
TOTAL UNIQUE CLAIMANTS
|
1,093
|
1,064
|
478
|
2.7
|
128.7
|
|
|
|
|
|
|
|
|
TOTAL GOODS-PRODUCING
|
2,019
|
1,971
|
572
|
2.4
|
253.0
|
|
Construction
|
441
|
503
|
213
|
-12.3
|
107.0
|
|
TOTAL SERVICE-PROVIDING
|
1,652
|
1,528
|
946
|
8.1
|
74.6
|
|
Trade, Transp., and Utilities
|
636
|
599
|
275
|
6.2
|
131.3
|
|
Financial Activities
|
165
|
171
|
55
|
-3.5
|
200.0
|
|
Professional & Business Svcs.
|
544
|
473
|
265
|
15.0
|
105.3
|
|
Educational & Health Svcs.
|
199
|
167
|
255
|
19.2
|
-22.0
|
|
Leisure & Hospitality
|
116
|
106
|
140
|
9.4
|
-17.1
|
|
TOTAL GOVERNMENT
|
82
|
92
|
57
|
-10.9
|
43.9
|
|
UNCLASSIFIED
|
117
|
102
|
51
|
14.7
|
129.4
|