
Local Jobs and Payroll in Wyoming in Fourth Quarter 2014: Slight Slowdown in Payroll and Job Growth
(Tables and Figures)
Tables 1, 2, 3, 4, 5, 6
Figures 1, 2
|
Average Monthly Employment Percentage Change Over the Previous |
Total Wages Percentage Change Over the Previous |
Average Weekly Wage Percentage Change Over the Previous |
||||
|---|---|---|---|---|---|---|
| Year | Quarter | Year | Quarter | Year | Quarter | |
| aPreliminary. Source: Quarterly Census of Employment and Wages, developed through a cooperative program between Research & Planning and the U.S. Bureau of Labor Statistics. Extract date: April 2015. |
||||||
| 2010Q4 | 1.1 | -2.1 | 6.0 | 7.7 | 4.8 | 10.0 |
| 2011Q4 | 2.0 | -1.5 | 2.5 | 3.7 | 0.5 | 5.2 |
| 2012Q4 | 0.3 | -1.8 | 4.1 | 7.6 | 3.7 | 9.7 |
| 2013Q4 | 0.6 | -1.8 | 1.5 | 7.2 | 0.9 | 9.1 |
| 2014Q4a | 1.6 | -2.1 | 5.5 | 6.4 | 3.9 | 8.7 |
| Five-Year Average for Q4 | 1.1 | -1.9 | 3.9 | 6.5 | 2.8 | 8.5 |
|
Average Monthly Employment |
Total Wages | |
|---|---|---|
| aPreliminary. Source: Quarterly Census of Employment and Wages, developed through a cooperative program between Research & Planning and the U.S. Bureau of Labor Statistics. Extract date: April 2015. |
||
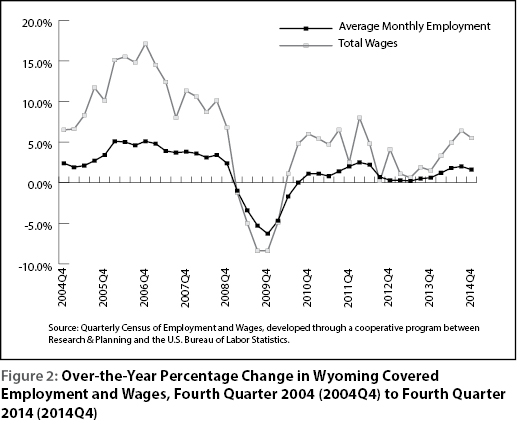
| 2005Q4 | 3.4 | 10.1 |
| 2006Q1 | 5.1 | 15.1 |
| 2006Q2 | 5.0 | 15.5 |
| 2006Q3 | 4.6 | 14.8 |
| 2006Q4 | 5.1 | 17.1 |
| 2007Q1 | 4.8 | 14.5 |
| 2007Q2 | 3.9 | 12.4 |
| 2007Q3 | 3.7 | 8.0 |
| 2007Q4 | 3.8 | 11.3 |
| 2008Q1 | 3.6 | 10.6 |
| 2008Q2 | 3.1 | 8.7 |
| 2008Q3 | 3.4 | 10.1 |
| 2008Q4 | 2.4 | 6.8 |
| 2009Q1 | -1.0 | -1.2 |
| 2009Q2 | -3.4 | -5.0 |
| 2009Q3 | -5.3 | -8.4 |
| 2009Q4 | -6.3 | -8.4 |
| 2010Q1 | -4.7 | -4.9 |
| 2010Q2 | -1.7 | 1.1 |
| 2010Q3 | 0.0 | 4.8 |
| 2010Q4 | 1.1 | 6.0 |
| 2011Q1 | 1.1 | 5.4 |
| 2011Q2 | 0.8 | 4.7 |
| 2011Q3 | 1.4 | 6.5 |
| 2011Q4 | 2.0 | 2.5 |
| 2012Q1 | 2.5 | 8.0 |
| 2012Q2 | 2.2 | 4.8 |
| 2012Q3 | 0.7 | 0.2 |
| 2012Q4 | 0.3 | 4.1 |
| 2013Q1 | 0.3 | 1.1 |
| 2013Q2 | 0.2 | 0.6 |
| 2013Q3 | 0.5 | 1.9 |
| 2013Q4 | 0.6 | 1.5 |
| 2014Q1 | 1.2 | 3.3 |
| 2014Q2 | 1.8 | 4.9 |
| 2014Q3 | 2.0 | 6.4 |
| 2014Q4a | 1.6 | 5.5 |
| Average Monthly Employment | Total Payroll | Average Weekly Wage | ||||||||||
|---|---|---|---|---|---|---|---|---|---|---|---|---|
| County | Fourth Quarter | Change | Fourth Quarter | Change | Fourth Quarter | Change | ||||||
| 2013 | 2014 | n | % | 2013 | 2014 | $ | % | 2013 | 2014 | $ | % | |
| Total | 280,701 | 285,127 | 4,426 | 1.6 | $3,344,359,716 | $3,528,773,837 | $184,414,121 | 5.5 | $916 | $952 | $36 | 3.9 |
| Albany | 15,671 | 15,528 | -144 | -0.9 | $147,364,841 | $147,957,333 | $592,492 | 0.4 | $723 | $733 | $10 | 1.3 |
| Big Horn | 4,255 | 4,390 | 135 | 3.2 | 44,081,678 | 46,553,359 | 2,471,681 | 5.6 | 797 | 816 | 19 | 2.4 |
| Campbell | 27,777 | 28,800 | 1,022 | 3.7 | 405,490,524 | 439,360,641 | 33,870,117 | 8.4 | 1,123 | 1,174 | 51 | 4.5 |
| Carbon | 7,287 | 7,272 | -14 | -0.2 | 84,927,122 | 84,844,334 | -82,788 | -0.1 | 897 | 897 | 1 | 0.1 |
| Converse | 6,253 | 6,646 | 393 | 6.3 | 76,553,297 | 87,825,233 | 11,271,936 | 14.7 | 942 | 1,016 | 75 | 7.9 |
| Crook | 2,298 | 2,323 | 25 | 1.1 | 22,290,355 | 23,458,766 | 1,168,411 | 5.2 | 746 | 777 | 31 | 4.1 |
| Fremont | 16,755 | 16,677 | -78 | -0.5 | 175,141,667 | 181,014,563 | 5,872,896 | 3.4 | 804 | 835 | 31 | 3.8 |
| Goshen | 4,752 | 4,570 | -182 | -3.8 | 41,474,474 | 41,420,601 | -53,873 | -0.1 | 671 | 697 | 26 | 3.9 |
| Hot Springs | 2,087 | 2,049 | -37 | -1.8 | 20,359,372 | 20,871,262 | 511,890 | 2.5 | 751 | 783 | 33 | 4.4 |
| Johnson | 3,347 | 3,384 | 37 | 1.1 | 31,602,633 | 33,780,318 | 2,177,685 | 6.9 | 726 | 768 | 41 | 5.7 |
| Laramie | 45,650 | 46,325 | 675 | 1.5 | 491,794,772 | 517,002,212 | 25,207,440 | 5.1 | 829 | 858 | 30 | 3.6 |
| Lincoln | 5,674 | 5,855 | 181 | 3.2 | 65,236,309 | 67,310,734 | 2,074,425 | 3.2 | 884 | 884 | 0 | 0.0 |
| Natrona | 42,234 | 43,332 | 1,098 | 2.6 | 557,887,029 | 609,019,215 | 51,132,186 | 9.2 | 1,016 | 1,081 | 65 | 6.4 |
| Niobrara | 1,007 | 949 | -57 | -5.7 | 9,755,712 | 8,362,000 | -1,393,712 | -14.3 | 745 | 678 | -68 | -9.1 |
| Park | 13,167 | 13,391 | 224 | 1.7 | 132,119,963 | 140,457,533 | 8,337,570 | 6.3 | 772 | 807 | 35 | 4.5 |
| Platte | 3,426 | 3,507 | 82 | 2.4 | 33,779,471 | 36,613,719 | 2,834,248 | 8.4 | 759 | 803 | 44 | 5.9 |
| Sheridan | 13,152 | 13,403 | 251 | 1.9 | 133,359,502 | 139,821,279 | 6,461,777 | 4.8 | 780 | 802 | 22 | 2.9 |
| Sublette | 5,127 | 4,901 | -226 | -4.4 | 78,823,154 | 77,672,654 | -1,150,500 | -1.5 | 1,183 | 1,219 | 36 | 3.1 |
| Sweetwater | 24,559 | 24,253 | -306 | -1.2 | 356,511,516 | 362,084,014 | 5,572,498 | 1.6 | 1,117 | 1,148 | 32 | 2.8 |
| Teton | 17,091 | 17,655 | 564 | 3.3 | 190,809,478 | 224,904,749 | 34,095,271 | 17.9 | 859 | 980 | 121 | 14.1 |
| Uinta | 8,862 | 8,985 | 123 | 1.4 | 124,434,132 | 100,868,254 | -23,565,878 | -18.9 | 1,080 | 864 | -217 | -20.1 |
| Washakie | 3,839 | 3,863 | 24 | 0.6 | 38,709,333 | 40,560,911 | 1,851,578 | 4.8 | 776 | 808 | 32 | 4.1 |
| Weston | 2,364 | 2,358 | -6 | -0.2 | 21,707,795 | 22,601,918 | 894,123 | 4.1 | 706 | 737 | 31 | 4.4 |
| Nonclassifiedb | 4,067 | 4,709 | 642 | 15.8 | 60,145,587 | 74,408,235 | 14,262,648 | 23.7 | 1,138 | 1,216 | 78 | 6.9 |
| aPreliminary. bThe employer may be located statewide or in more than one county. Source: Quarterly Census of Employment and Wages, developed through a cooperative program between Research & Planning and the U.S. Bureau of Labor Statistics. Extract date: April 2015. |
||||||||||||
| Average Monthly Employment | Total Payroll |
Average Weekly Wage |
||||||||||
|---|---|---|---|---|---|---|---|---|---|---|---|---|
| NAICSb Title | Fourth Quarter | Change | Fourth Quarter | Change | Fourth Quarter | Change | ||||||
| 2013 | 2014 | n | % | 2013 | 2014 | $ | % | 2013 | 2014 | $ | % | |
| aPreliminary. bNorth American Industry Classification System. ND-Not disclosable due to confidentiality of information. Source: Quarterly Census of Employment and Wages, developed through a cooperative program between Research & Planning and the U.S. Bureau of Labor Statistics. Extract date: April 2015. |
||||||||||||
| Total, All Industries | 42,234 | 43,332 | 1,098 | 2.6 | $557,887,029 | $609,019,215 | $51,132,186 | 9.2 | $1,016 | $1,081 | $65 | 6.4 |
| Total Private | 36,402 | 37,441 | 1,039 | 2.9 | $488,906,603 | $537,572,410 | $48,665,807 | 10.0 | $1,033 | $1,104 | $71 | 6.9 |
| Agriculture | 116 | 125 | 9 | 7.8 | 941,498 | 1,034,766 | 93,268 | 9.9 | 624 | 637 | 13 | 2.1 |
| Mining | 4,164 | 4,643 | 479 | 11.5 | 102,786,673 | 122,053,542 | 19,266,869 | 18.7 | 1,899 | 2,022 | 123 | 6.5 |
| Utilities | 138 | 147 | 9 | 6.5 | 3,685,290 | 3,556,075 | -129,215 | -3.5 | 2,054 | 1,861 | -193 | -9.4 |
| Construction | 3,189 | 3,473 | 284 | 8.9 | 49,109,652 | 56,087,268 | 6,977,616 | 14.2 | 1,185 | 1,242 | 57 | 4.8 |
| Manufacturing | 1,710 | 1,839 | 129 | 7.5 | 24,971,512 | 29,046,349 | 4,074,837 | 16.3 | 1,123 | 1,215 | 92 | 8.2 |
| Wholesale Trade | 2,882 | 2,897 | 15 | 0.5 | 54,275,103 | 57,960,786 | 3,685,683 | 6.8 | 1,449 | 1,539 | 90 | 6.2 |
| Retail Trade | 5,051 | 5,038 | -13 | -0.3 | 40,305,353 | 39,980,155 | -325,198 | -0.8 | 614 | 610 | -4 | -0.7 |
| Transportation & Warehousing | 1,236 | 1,436 | 200 | 16.2 | 18,730,037 | 23,559,281 | 4,829,244 | 25.8 | 1,166 | 1,262 | 96 | 8.2 |
| Information | 435 | 421 | -14 | -3.2 | 4,629,293 | 4,512,915 | -116,378 | -2.5 | 819 | 825 | 6 | 0.7 |
| Finance & Insurance | 1,078 | 1,039 | -39 | -3.6 | 15,344,025 | 15,791,721 | 447,696 | 2.9 | 1,095 | 1,169 | 74 | 6.8 |
| Real Estate & Rental & Leasing | 994 | 1,041 | 47 | 4.7 | 12,447,123 | 13,942,168 | 1,495,045 | 12.0 | 963 | 1,030 | 67 | 7.0 |
| Professional & Technical Services | 1,480 | 1,540 | 60 | 4.1 | 26,789,607 | 29,811,027 | 3,021,420 | 11.3 | 1,392 | 1,489 | 97 | 7.0 |
| Mgmt. of Companies & Enterprises | 205 | 192 | -13 | -6.3 | 4,524,350 | 4,348,590 | -175,760 | -3.9 | 1,698 | 1,742 | 44 | 2.6 |
| Administrative & Waste Services | 1,405 | 1,303 | -102 | -7.3 | 11,489,114 | 11,082,413 | -406,701 | -3.5 | 629 | 654 | 25 | 4.0 |
| Educational Services | 155 | 124 | -31 | -20.0 | 796,831 | 711,308 | -85,523 | -10.7 | 395 | 441 | 46 | 11.6 |
| Health Care & Social Assistance | 5,821 | 5,861 | 40 | 0.7 | 79,954,981 | 84,524,987 | 4,570,006 | 5.7 | 1,057 | 1,109 | 52 | 4.9 |
| Ambulatory Health Care Services | 2,126 | 2,186 | 60 | 2.8 | 44,075,843 | 47,149,909 | 3,074,066 | 7.0 | 1,595 | 1,659 | 64 | 4.0 |
| Hospitals | 1,635 | 1,634 | -1 | -0.1 | 22,415,079 | 23,345,887 | 930,808 | 4.2 | 1,055 | 1,099 | 44 | 4.2 |
| Nursing & Res.Care Facilities | 967 | 957 | -10 | -1.0 | 7,674,766 | 7,921,703 | 246,937 | 3.2 | 611 | 637 | 26 | 4.3 |
| Social assistance | 1,093 | 1,083 | -10 | -0.9 | 5,789,293 | 6,107,488 | 318,195 | 5.5 | 407 | 434 | 27 | 6.6 |
| Arts, Entertainment, & Recreation | 442 | 484 | 42 | 9.5 | 1,782,107 | 1,959,099 | 176,992 | 9.9 | 310 | 311 | 1 | 0.3 |
| Accommodation & Food Services | 4,123 | 4,168 | 45 | 1.1 | 16,873,560 | 18,629,688 | 1,756,128 | 10.4 | 315 | 344 | 29 | 9.2 |
| Other Services | 1,780 | 1,671 | -109 | -6.1 | 19,470,494 | 18,980,272 | -490,222 | -2.5 | 841 | 874 | 33 | 3.9 |
| Total Government | 5,832 | 5,891 | 59 | 1.0 | $68,980,426 | $71,446,805 | $2,466,379 | 3.6 | $910 | $933 | $23 | 2.5 |
| Federal Government | 638 | 629 | -9 | -1.4 | 9,871,855 | 10,135,446 | 263,591 | 2.7 | 1,190 | 1,240 | 50 | 4.2 |
| State Government | 710 | 706 | -4 | -0.6 | 9,552,786 | 9,674,195 | 121,409 | 1.3 | 1,035 | 1,054 | 19 | 1.8 |
| Local Government | 4,484 | 4,556 | 72 | 1.6 | 49,555,785 | 51,637,164 | 2,081,379 | 4.2 | 850 | 872 | 22 | 2.6 |
| Local Government Education | ND | ND | ND | ND | ND | ND | ND | ND | ND | ND | ND | ND |
| Average Monthly Employment | Total Payroll | Average Weekly Wage | ||||||||||
|---|---|---|---|---|---|---|---|---|---|---|---|---|
| NAICSb Title | Fourth Quarter | Change | Fourth Quarter | Change | Fourth Quarter | Change | ||||||
| 2013 | 2014 | n | % | 2013 | 2014 | $ | % | 2013 | 2014 | $ | % | |
| aPreliminary. bNorth American Industry Classification System. Source: Quarterly Census of Employment and Wages, developed through a cooperative program between Research & Planning and the U.S. Bureau of Labor Statistics. Extract date: April 2015. |
||||||||||||
| Total, All Industries | 45,650 | 46,325 | 675 | 1.5 | $491,794,772 | $517,002,212 | $25,207,440 | 5.1 | $829 | $858 | $29 | 3.5 |
| Total Private | 31,943 | 32,617 | 674 | 2.1 | $318,424,057 | $340,111,507 | $21,687,450 | 6.8 | $767 | $802 | $35 | 4.6 |
| Agriculture | 325 | 329 | 4 | 1.2 | 2,745,116 | 3,143,584 | 398,468 | 14.5 | 650 | 735 | 85 | 13.1 |
| Mining | 279 | 545 | 266 | 95.3 | 5,833,776 | 11,230,671 | 5,396,895 | 92.5 | 1,608 | 1,585 | -23 | -1.4 |
| Utilities | 157 | 174 | 17 | 10.8 | 3,173,127 | 3,582,166 | 409,039 | 12.9 | 1,555 | 1,584 | 29 | 1.9 |
| Construction | 3,287 | 3,377 | 90 | 2.7 | 40,671,672 | 43,696,210 | 3,024,538 | 7.4 | 952 | 995 | 43 | 4.5 |
| Manufacturing | 1,366 | 1,341 | -25 | -1.8 | 23,897,091 | 23,348,875 | -548,216 | -2.3 | 1,346 | 1,339 | -7 | -0.5 |
| Wholesale Trade | 979 | 1,011 | 32 | 3.3 | 14,066,278 | 15,588,305 | 1,522,027 | 10.8 | 1,105 | 1,186 | 81 | 7.3 |
| Retail Trade | 5,842 | 5,529 | -313 | -5.4 | 38,479,304 | 37,849,408 | -629,896 | -1.6 | 507 | 527 | 20 | 3.9 |
| Transportation & Warehousing | 2,627 | 3,171 | 544 | 20.7 | 26,296,461 | 33,495,976 | 7,199,515 | 27.4 | 770 | 813 | 43 | 5.6 |
| Information | 1,137 | 1,188 | 51 | 4.5 | 14,324,536 | 15,154,021 | 829,485 | 5.8 | 969 | 981 | 12 | 1.2 |
| Finance & Insurance | 1,695 | 1,704 | 9 | 0.5 | 23,269,914 | 25,466,084 | 2,196,170 | 9.4 | 1,056 | 1,150 | 94 | 8.9 |
| Real Estate & Rental & Leasing | 571 | 585 | 14 | 2.5 | 5,654,772 | 6,060,037 | 405,265 | 7.2 | 762 | 797 | 35 | 4.6 |
| Professional & Technical Services | 1,601 | 1,574 | -27 | -1.7 | 26,251,149 | 25,803,039 | -448,110 | -1.7 | 1,261 | 1,261 | 0 | 0.0 |
| Mgmt. of Companies & Enterprises | 94 | 59 | -35 | -37.2 | 1,433,733 | 1,133,735 | -299,998 | -20.9 | 1,173 | 1,478 | 305 | 26.0 |
| Administrative & Waste Services | 1,676 | 1,764 | 88 | 5.3 | 10,837,730 | 12,660,684 | 1,822,954 | 16.8 | 497 | 552 | 55 | 11.1 |
| Educational Services | 246 | 246 | 0 | 0.0 | 1,634,450 | 2,054,713 | 420,263 | 25.7 | 511 | 642 | 131 | 25.6 |
| Health Care & Social Assistance | 4,029 | 3,971 | -58 | -1.4 | 47,337,753 | 49,014,824 | 1,677,071 | 3.5 | 904 | 949 | 45 | 5.0 |
| Ambulatory Health Care Services | 2,023 | 1,991 | -32 | -1.6 | 34,275,519 | 35,610,831 | 1,335,312 | 3.9 | 1,303 | 1,376 | 73 | 5.6 |
| Nursing & Res. Care Facilities | 852 | 809 | -43 | -5.0 | 6,442,314 | 6,434,762 | -7,552 | -0.1 | 582 | 612 | 30 | 5.2 |
| Hospitals & Social Assistance | 1,154 | 1,171 | 16 | 1.4 | 6,619,920 | 6,969,231 | 349,311 | 5.3 | 441 | 458 | 17 | 3.8 |
| Arts, Entertainment, & Recreation | 276 | 284 | 8 | 2.9 | 1,263,172 | 1,212,563 | -50,609 | -4.0 | 352 | 328 | -24 | -6.8 |
| Accommodation & Food Services | 4,341 | 4,461 | 120 | 2.8 | 16,963,235 | 18,409,994 | 1,446,759 | 8.5 | 301 | 317 | 16 | 5.3 |
| Other Services | 1,416 | 1,304 | -112 | -7.9 | 14,290,788 | 11,206,618 | -3,084,170 | -21.6 | 776 | 661 | -115 | -14.8 |
| Total Government | 13,708 | 13,708 | 0 | 0.0 | $173,370,715 | $176,890,705 | $3,519,990 | 2.0 | $973 | $993 | $20 | 2.1 |
| Federal Government | 2,504 | 2,531 | 27 | 1.1 | 37,278,629 | 38,154,201 | 875,572 | 2.3 | 1,145 | 1,160 | 15 | 1.3 |
| State Government | 3,936 | 3,902 | -34 | -0.9 | 57,385,362 | 58,184,701 | 799,339 | 1.4 | 1,122 | 1,147 | 25 | 2.2 |
| Local Government | 7,268 | 7,275 | 7 | 0.1 | 78,706,724 | 80,551,803 | 1,845,079 | 2.3 | 833 | 852 | 19 | 2.3 |
| Local Government Education | 3,857 | 3,934 | 77 | 2.0 | 40,390,677 | 41,472,938 | 1,082,261 | 2.7 | 806 | 811 | 5 | 0.7 |
|
Average Monthly Employment |
Total Payroll | Average Weekly Wage | ||||||||||
|---|---|---|---|---|---|---|---|---|---|---|---|---|
| Fourth Quarter | Change | Fourth Quarter | Change | Fourth Quarter | Change | |||||||
| NAICSb Title | 2013 | 2014 | n | % | 2013 | 2014 | $ | % | 2013 | 2014 | $ | % |
| aPreliminary. bNorth American Industry Classification System. Source: Quarterly Census of Employment and Wages, developed through a cooperative program between Research & Planning and the U.S. Bureau of Labor Statistics. Extract date: April 2015. |
||||||||||||
| Total, All Industries | 280,701 | 285,127 | 4,426 | 1.6 | $3,344,359,716 | $3,528,773,837 | $184,414,121 | 5.5 | $916 | $952 | $36 | 3.9 |
| Total Private | 213,334 | 217,945 | 4,611 | 2.2 | $2,577,052,074 | $2,743,736,228 | $166,684,154 | 6.5 | $929 | $968 | $39 | 4.2 |
| Agriculture | 2,577 | 2,470 | -107 | -4.2 | 24,834,974 | 26,043,496 | 1,208,522 | 4.9 | 741 | 811 | 70 | 9.4 |
| Mining | 26,823 | 27,665 | 842 | 3.1 | 593,146,617 | 636,474,015 | 43,327,398 | 7.3 | 1,701 | 1,770 | 69 | 4.1 |
| Utilities | 2,478 | 2,499 | 21 | 0.8 | 57,604,609 | 59,079,349 | 1,474,740 | 2.6 | 1,788 | 1,819 | 31 | 1.7 |
| Construction | 22,337 | 24,003 | 1,666 | 7.5 | 326,753,112 | 338,083,507 | 11,330,395 | 3.5 | 1,125 | 1,083 | -42 | -3.7 |
| Manufacturing | 9,793 | 10,130 | 337 | 3.4 | 145,789,323 | 158,527,209 | 12,737,886 | 8.7 | 1,145 | 1,204 | 59 | 5.2 |
| Wholesale Trade | 9,428 | 9,604 | 176 | 1.9 | 151,241,945 | 183,035,682 | 31,793,737 | 21.0 | 1,234 | 1,466 | 232 | 18.8 |
| Retail Trade | 30,204 | 30,188 | -16 | -0.1 | 210,996,407 | 220,246,114 | 9,249,707 | 4.4 | 537 | 561 | 24 | 4.5 |
| Transportation & Warehousing | 9,927 | 10,916 | 989 | 10.0 | 123,400,343 | 143,063,498 | 19,663,155 | 15.9 | 956 | 1,008 | 52 | 5.4 |
| Information | 3,806 | 3,754 | -52 | -1.4 | 42,920,418 | 44,268,827 | 1,348,409 | 3.1 | 867 | 907 | 40 | 4.6 |
| Finance & Insurance | 6,797 | 6,797 | 0 | 0.0 | 96,174,377 | 104,511,740 | 8,337,363 | 8.7 | 1,088 | 1,183 | 95 | 8.7 |
| Real Estate & Rental & Leasing | 4,406 | 4,505 | 99 | 2.2 | 52,816,710 | 55,373,211 | 2,556,501 | 4.8 | 922 | 946 | 24 | 2.6 |
| Professional & Technical Services | 9,263 | 9,527 | 264 | 2.9 | 164,490,875 | 167,893,209 | 3,402,334 | 2.1 | 1,366 | 1,356 | -10 | -0.7 |
| Mgmt. of Companies & Enterprises | 1,017 | 983 | -34 | -3.3 | 21,457,453 | 22,398,857 | 941,404 | 4.4 | 1,623 | 1,753 | 130 | 8.0 |
| Administrative & Waste Services | 7,961 | 7,858 | -103 | -1.3 | 64,050,976 | 66,050,651 | 1,999,675 | 3.1 | 619 | 647 | 28 | 4.5 |
| Educational Services | 1,755 | 1,710 | -45 | -2.6 | 13,538,858 | 13,260,051 | -278,807 | -2.1 | 593 | 596 | 3 | 0.5 |
| Health Care & Social Assistance | 24,009 | 24,113 | 104 | 0.4 | 267,797,142 | 274,697,752 | 6,900,610 | 2.6 | 858 | 876 | 18 | 2.1 |
| Ambulatory Health Care Services | 9,509 | 9,724 | 215 | 2.3 | 154,823,184 | 160,222,378 | 5,399,194 | 3.5 | 1,252 | 1,267 | 15 | 1.2 |
| Hospitals | 3,038 | 3,001 | -37 | -1.2 | 41,822,941 | 41,857,286 | 34,345 | 0.1 | 1,059 | 1,073 | 14 | 1.3 |
| Nursing & Res. Care Facilities | 4,527 | 4,508 | -19 | -0.4 | 33,581,363 | 34,456,959 | 875,596 | 2.6 | 571 | 588 | 17 | 3.0 |
| Social Assistance | 6,935 | 6,880 | -55 | -0.8 | 37,569,654 | 38,161,129 | 591,475 | 1.6 | 417 | 427 | 10 | 2.4 |
| Arts, Entertainment, & Recreation | 2,530 | 2,699 | 169 | 6.7 | 13,504,513 | 15,299,428 | 1,794,915 | 13.3 | 411 | 436 | 25 | 6.1 |
| Accommodation & Food Services | 30,218 | 30,761 | 543 | 1.8 | 130,987,159 | 141,598,894 | 10,611,735 | 8.1 | 333 | 354 | 21 | 6.3 |
| Other Services | 8,005 | 7,764 | -241 | -3.0 | 75,546,263 | 73,830,738 | -1,715,525 | -2.3 | 726 | 731 | 5 | 0.7 |
| Total Government | 67,367 | 67,181 | -186 | -0.3 | $767,307,642 | $785,037,609 | $17,729,967 | 2.3 | $876 | $899 | $23 | 2.6 |
| Federal Government | 7,129 | 7,075 | -54 | -0.8 | 99,289,364 | 100,613,417 | 1,324,053 | 1.3 | 1,071 | 1,094 | 23 | 2.1 |
| State Government | 13,015 | 12,816 | -199 | -1.5 | 172,969,946 | 172,548,365 | -421,581 | -0.2 | 1,022 | 1,036 | 14 | 1.4 |
| State Government Education | 3,533 | 3,493 | -40 | -1.1 | 46,643,185 | 45,157,014 | -1,486,171 | -3.2 | 1,016 | 995 | -21 | -2.1 |
| Local Government | 47,222 | 47,291 | 69 | 0.1 | 495,048,332 | 511,875,827 | 16,827,495 | 3.4 | 806 | 833 | 27 | 3.3 |
| Local Government Education | 24,800 | 24,998 | 198 | 0.8 | 248,890,721 | 253,101,637 | 4,210,916 | 1.7 | 772 | 779 | 7 | 0.9 |
| Hospitals | 7,056 | 7,137 | 80 | 1.1 | 97,253,065 | 103,861,673 | 6,608,608 | 6.8 | 1,060 | 1,119 | 59 | 5.6 |