
New Demographics and Earnings Tables Available from R&P
(Tables and Figures)
Related Article Demographics and Earnings Tables
| 2000 | 2014 | Change, 2000-2014 | ||||
|---|---|---|---|---|---|---|
| Age Group | N | % | N | % | N | % |
| Source: Wage Records. | ||||||
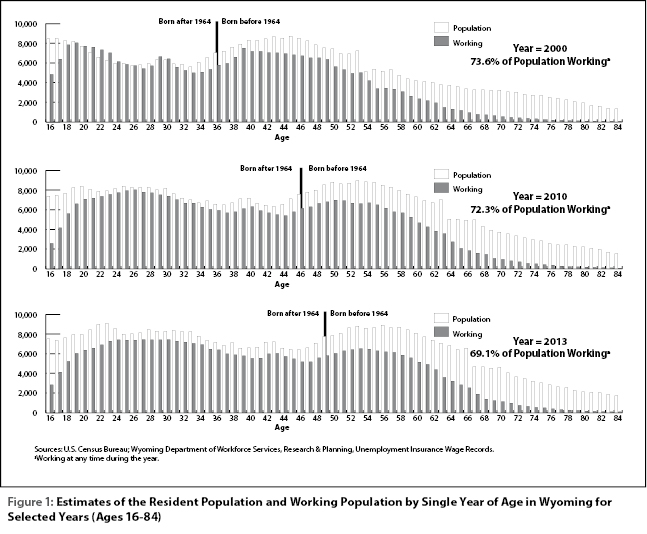
| 19 and Younger | 32,774 | 10.6% | 20,120 | 5.5% | -12,654 | -38.6% |
| 20-24 | 35,003 | 11.4% | 32,302 | 8.8% | -2,701 | -7.7% |
| 25-34 | 55,456 | 18.0% | 70,309 | 19.2% | 14,853 | 26.8% |
| 35-44 | 66,413 | 21.5% | 58,122 | 15.9% | -8,291 | -12.5% |
| 45-54 | 57,453 | 18.6% | 55,733 | 15.2% | -1,720 | -3.0% |
| 55+ | 32,142 | 10.4% | 67,341 | 18.4% | 35,199 | 109.5% |
| Nonresidents | 29,056 | 9.4% | 62,577 | 17.1% | 33,521 | 115.4% |
| Total | 308,297 | 100.0% | 366,504 | 100.0% | 58,207 | 18.9% |
| 55 and Older | |||
|---|---|---|---|
| County | Total | N | % |
| Source: Wage Records. | |||
| Hot Springs | 2,543 | 689 | 27.1% |
| Washakie | 4,484 | 1,196 | 26.7% |
| Niobrara | 1,169 | 298 | 25.5% |
| Weston | 2,728 | 676 | 24.8% |
| Goshen | 5,541 | 1,361 | 24.6% |
| Park | 15,741 | 3,832 | 24.3% |
| Big Horn | 5,303 | 1,282 | 24.2% |
| Platte | 4,362 | 1,020 | 23.4% |
| Sheridan | 15,635 | 3,459 | 22.1% |
| Crook | 2,886 | 632 | 21.9% |
| Fremont | 20,997 | 4,585 | 21.8% |
| Lincoln | 6,960 | 1,511 | 21.7% |
| Johnson | 4,397 | 943 | 21.4% |
| Carbon | 9,207 | 1,762 | 19.1% |
| Sweetwater | 29,127 | 5,440 | 18.7% |
| Laramie | 53,761 | 10,021 | 18.6% |
| Uinta | 11,142 | 2,053 | 18.4% |
| Wyoming | 366,504 | 67,341 | 18.4% |
| Converse | 7,723 | 1,412 | 18.3% |
| Natrona | 51,926 | 9,437 | 18.2% |
| Campbell | 34,936 | 6,045 | 17.3% |
| Sublette | 6,411 | 1,101 | 17.2% |
| Albany | 17,769 | 3,047 | 17.1% |
| Teton | 24,684 | 3,283 | 13.3% |
| Unspecified | 27,072 | 2,256 | 8.3% |
| Average Annual Wages | Employment | ||||||||||
|---|---|---|---|---|---|---|---|---|---|---|---|
| Females | Males | Nonresidents | Total | ||||||||
| Industry | Females | Males | Gender Wage Gapa | N | Row % | N | Row % | N | Row % | N | Row % |
|
Source: Unemployment Insurance Wage Records. aFemales’ earnings as a percentage of males’ earnings. |
|||||||||||
| Agriculture, Forestry, Fishing, & Hunting | $19,358 | $28,827 | 67.2% | 723 | 19.2 | 2,215 | 59.0 | 818 | 21.8 | 3,756 | 100.0 |
| Mining | $54,787 | $75,876 | 72.2% | 3,100 | 9.0 | 25,701 | 74.7 | 5,622 | 16.3 | 34,423 | 100.0 |
| Construction | $28,505 | $36,306 | 78.5% | 3,039 | 7.3 | 24,132 | 57.7 | 14,660 | 35.0 | 41,831 | 100.0 |
| Manufacturing | $31,580 | $58,751 | 53.8% | 2,271 | 18.8 | 8,706 | 72.0 | 1,115 | 9.2 | 12,092 | 100.0 |
| Wholesale Trade, Trans., Utilities, & Warehousing | $32,575 | $56,092 | 58.1% | 4,964 | 18.9 | 18,509 | 70.4 | 2,824 | 10.7 | 26,297 | 100.0 |
| Retail Trade | $17,154 | $27,514 | 62.3% | 19,038 | 46.3 | 16,424 | 39.9 | 5,661 | 13.8 | 41,123 | 100.0 |
| Information | $29,532 | $46,406 | 63.6% | 1,636 | 37.2 | 2,381 | 54.1 | 382 | 8.7 | 4,399 | 100.0 |
| Financial Activities | $34,538 | $63,821 | 54.1% | 7,318 | 55.7 | 4,776 | 36.4 | 1,037 | 7.9 | 13,131 | 100.0 |
| Professional & Business Services | $28,713 | $47,154 | 60.9% | 9,016 | 34.3 | 12,426 | 47.3 | 4,837 | 18.4 | 26,279 | 100.0 |
| Educational Services | $33,391 | $43,827 | 76.2% | 21,815 | 63.8 | 10,089 | 29.5 | 2,273 | 6.7 | 34,177 | 100.0 |
| Health Care & Social Assistance | $32,438 | $72,365 | 44.8% | 26,377 | 75.3 | 6,162 | 17.6 | 2,511 | 7.2 | 35,050 | 100.0 |
| Leisure & Hospitality | $12,083 | $16,236 | 74.4% | 21,248 | 39.6 | 16,008 | 29.8 | 16,420 | 30.6 | 53,676 | 100.0 |
| Other Services | $21,183 | $38,855 | 54.5% | 3,807 | 39.8 | 4,427 | 46.3 | 1,330 | 13.9 | 9,564 | 100.0 |
| Public Administration | $34,770 | $43,926 | 79.2% | 14,158 | 46.1 | 14,756 | 48.1 | 1,792 | 5.8 | 30,706 | 100.0 |
| Total, All Industries | $27,464 | $47,154 | 58.2% | 138,510 | 37.8 | 166,712 | 45.5 | 61,282 | 16.7 | 366,504 | 100.0 |