Continued
Claims
|
Continued Weeks Claimed
|
% Change Weeks Claimed
|
Mar
16 |
Mar
16 |
Mar
16 |
Feb
16 |
Mar
15 |
Feb
16 |
Mar
15 |
|
Wyoming Statewide
|
|
|
|
|
|
|
TOTAL WEEKS CLAIMED |
35,930
|
36,124
|
26,775
|
-0.5
|
34.2
|
|
TOTAL UNIQUE CLAIMANTS |
8,812
|
10,297
|
7,811
|
-14.4
|
12.8
|
|
Benefit Exhaustions |
622
|
544
|
401
|
14.3
|
55.1
|
|
Benefit Exhaustion Rates |
7.1%
|
5.3%
|
5.1%
|
1.8%
|
1.9%
|
|
TOTAL GOODS-PRODUCING |
17,319
|
17,247
|
13,506
|
0.4
|
28.2
|
|
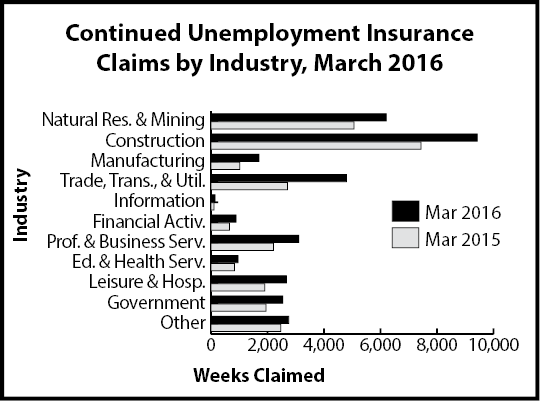
Natural Res. & Mining
|
6,200
|
4,990
|
5,056
|
24.2
|
22.6
|
|
Mining |
6,004
|
4,793
|
4,888
|
25.3
|
22.8
|
|
Oil & Gas Extraction
|
527
|
491
|
389
|
7.3
|
35.5
|
|
Construction |
9,425
|
10,621
|
7,430
|
-11.3
|
26.9
|
|
Manufacturing |
1,692
|
1,635
|
1,018
|
3.5
|
66.2
|
|
TOTAL SERVICE-PROVIDING |
13,328
|
12,926
|
8,860
|
3.1
|
50.4
|
|
Trade, Transp., & Utilities
|
4,794
|
4,422
|
2,701
|
8.4
|
77.5
|
|
Wholesale Trade |
1,300
|
1,059
|
533
|
22.8
|
143.9
|
|
Retail Trade |
1,621
|
1,591
|
1,000
|
1.9
|
62.1
|
|
Transp., Warehousing & Utilities
|
1,873
|
1,772
|
1,168
|
5.7
|
60.4
|
|
Information |
140
|
158
|
102
|
-11.4
|
37.3
|
|
Financial Activities |
881
|
816
|
654
|
8.0
|
34.7
|
|
Prof. & Business Services
|
3,103
|
3,116
|
2,208
|
-0.4
|
40.5
|
|
Educational & Health Svcs.
|
952
|
997
|
825
|
-4.5
|
15.4
|
|
Leisure and Hospitality |
2,665
|
2,672
|
1,902
|
-0.3
|
40.1
|
|
Other Svcs., exc. Public Admin. |
787
|
736
|
460
|
6.9
|
71.1
|
|
TOTAL GOVERNMENT |
2,536
|
2,792
|
1,943
|
-9.2
|
30.5
|
|
Federal Government |
892
|
1,104
|
1,008
|
-19.2
|
-11.5
|
|
State Government |
285
|
286
|
215
|
-0.3
|
32.6
|
|
Local Government |
1,357
|
1,401
|
718
|
-3.1
|
89.0
|
|
Local Education |
152
|
166
|
105
|
-8.4
|
44.8
|
|
UNCLASSIFIED |
2,746
|
3,157
|
2,465
|
-13.0
|
11.4
|
|
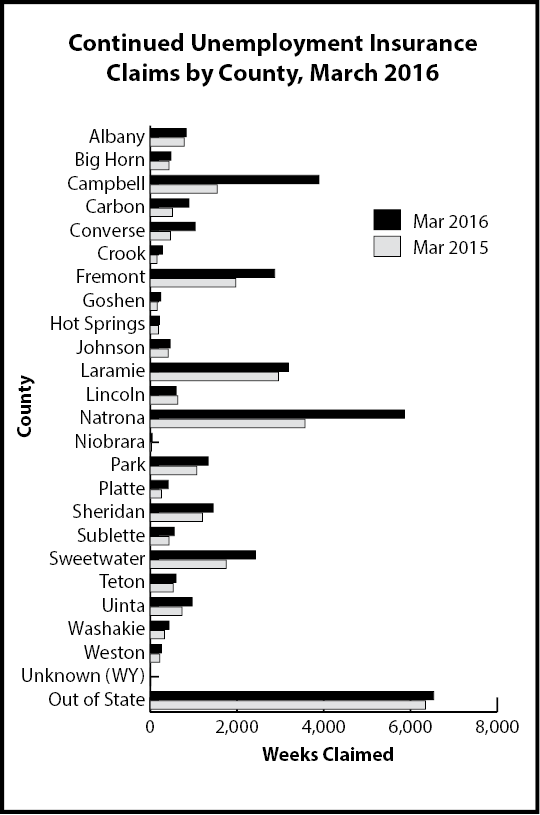
Laramie County |
|
|
|
|
|
|
TOTAL WEEKS CLAIMED |
3,187
|
3,602
|
2,958
|
-11.5
|
7.7
|
|
TOTAL UNIQUE CLAIMANTS |
834
|
1,048
|
897
|
-20.4
|
-7.0
|
|
TOTAL GOODS-PRODUCING |
1,563
|
1,993
|
1,366
|
-21.6
|
14.4
|
|
Construction |
1,229
|
1,639
|
1,071
|
-25.0
|
14.8
|
|
TOTAL SERVICE-PROVIDING |
1,247
|
1,215
|
1,214
|
2.6
|
2.7
|
|
Trade, Transp., and Utilities |
483
|
472
|
411
|
2.3
|
17.5
|
|
Financial Activities |
107
|
105
|
88
|
1.9
|
21.6
|
|
Prof. & Business Svcs.
|
311
|
299
|
325
|
4.0
|
-4.3
|
|
Educational and Health Svcs. |
163
|
149
|
209
|
9.4
|
-22.0
|
|
Leisure & Hospitality
|
94
|
110
|
120
|
-14.5
|
-21.7
|
|
TOTAL GOVERNMENT |
255
|
263
|
234
|
-3.0
|
9.0
|
|
UNCLASSIFIED |
120
|
129
|
142
|
-7.0
|
-15.5
|
|
Natrona County |
|
|
|
|
|
|
TOTAL WEEKS CLAIMED |
5,866
|
5,934
|
3,571
|
-1.1
|
64.3
|
|
TOTAL UNIQUE CLAIMANTS |
1,478
|
1,725
|
1,067
|
-14.3
|
38.5
|
|
TOTAL GOODS-PRODUCING |
3,025
|
3,128
|
2,019
|
-3.3
|
49.8
|
|
Construction |
1,337
|
1,742
|
909
|
-23.2
|
47.1
|
|
TOTAL SERVICE-PROVIDING |
2,621
|
2,567
|
1,316
|
2.1
|
99.2
|
|
Trade, Transp., and Utilities |
1,110
|
1,049
|
483
|
5.8
|
129.8
|
|
Financial Activities |
208
|
187
|
94
|
11.2
|
121.3
|
|
Professional & Business Svcs.
|
502
|
548
|
309
|
-8.4
|
62.5
|
|
Educational & Health Svcs.
|
208
|
189
|
183
|
10.1
|
13.7
|
|
Leisure & Hospitality
|
322
|
377
|
153
|
-14.6
|
110.5
|
|
TOTAL GOVERNMENT |
90
|
96
|
113
|
-6.3
|
-20.4
|
|
UNCLASSIFIED |
129
|
141
|
121
|
-8.5
|
6.6
|