Wyoming Unemployment Rate Rises to 5.0% in February 2016
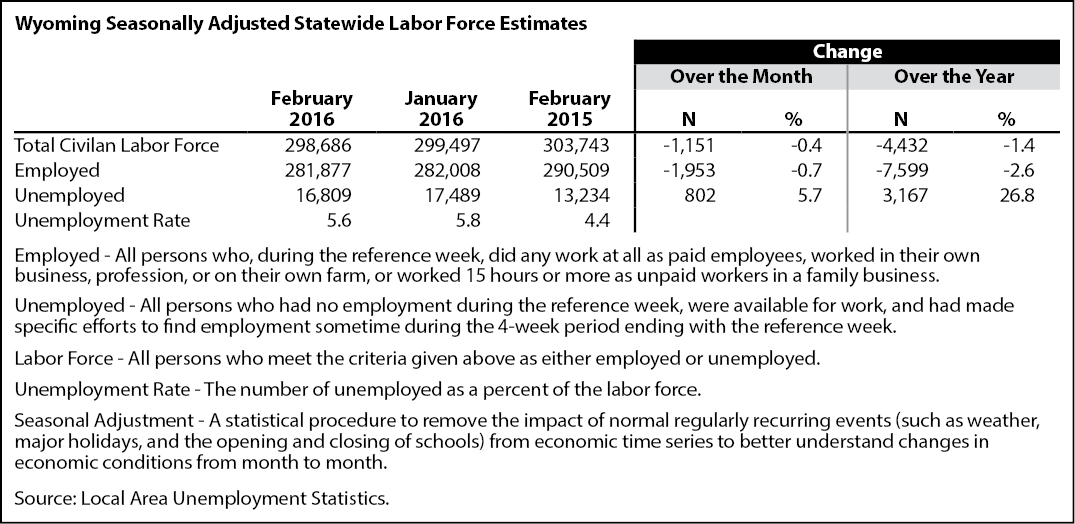
The Research & Planning section of the Wyoming Department of Workforce Services reported that the state’s seasonally adjusted1 unemployment rate increased significantly from 4.7% in January to 5.0% in February. Wyoming’s unemployment rate was much higher than its February 2015 level of 3.8% (a statistically significant increase) and was slightly higher than the current U.S. unemployment rate of 4.9%. Seasonally adjusted employment of Wyoming residents declined from January to February, falling by an estimated 1,953 individuals (-0.7%; a statistically significant decrease).
From January to February, most county unemployment rates changed very little. The largest increases occurred in Washakie (up from 5.3% to 5.7%), Campbell (up from 6.0% to 6.3%), and Carbon (up from 5.3% to 5.5%) counties. The largest declines were reported in Niobrara (down from 4.3% to 3.5%), Teton (down from 3.7% to 3.0%), Sheridan (down from 6.4% to 5.9%), and Laramie (down from 5.0% to 4.5%) counties.
In February 2016, unemployment rates were higher than a year earlier in 21 counties and lower in two counties. The largest over-the-year increases were seen in Natrona (up from 4.2% to 7.2%), Campbell (up from 3.6% to 6.3%), Converse (up from 3.4% to 5.8%), Fremont (up from 5.8% to 8.1%), and Sweetwater (up from 4.5% to 6.0%) counties. Unemployment rates fell in Teton (down from 3.7% to 3.0%) and Albany (down from 3.3% to 3.1%) counties.
The lowest unemployment rates were found in Teton (3.0%), Albany (3.1%), and Niobrara (3.5%) counties. The highest unemployment rates occurred in Fremont (8.1%), Natrona (7.2%), and Johnson (7.0%) counties.
Total nonfarm employment (measured by place of work) fell from 286,100 in February 2015 to 277,000 in February 2016, a decrease of 9,100 jobs (or –3.2%; a statistically significant decrease).
1Seasonal adjustment is a statistical procedure to remove the impact of normal regularly recurring events (such as weather, major holidays, and the opening and closing of schools) from economic time series to better understand changes in economic conditions from month to month.
2Due to the significant increase in unemployment, Research & Planning has posted supplemental tables online at http://doe.state.wy.us/LMI/news.htm.