Economic Indicators
The amount of benefits paid by Wyoming Unemployment Insurance increased 58.3% from February 2015 to February 2016.
| Feb | Jan | Feb | Percent Change | ||||
|---|---|---|---|---|---|---|---|
| 2016 (p) | 2016 (r) | 2015 (b) | Month | Year | |||
|
(p) Preliminary. (r) Revised. (b) Benchmarked. 1Local Area Unemployment Statistics Program estimates. 2Metropolitan Statistical Area. Note: Production worker hours and earnings data have been dropped from the Economic Indicators page because of problems with accuracy due to a small sample size and high item nonresponse. The Bureau of Labor Statistics will continue to publish these data online at http://www.bls.gov/eag/eag.wy.htm. |
|||||||
|
Wyoming Total Nonfarm Employment |
277,000 | 277,300 | 286,100 | -0.1 | -3.2 | ||
|
Wyoming State Government |
15,800 | 15,400 | 15,700 | 2.6 | 0.6 | ||
|
Laramie County Nonfarm Employment |
46,600 | 46,200 | 46,500 | 0.9 | 0.2 | ||
|
Natrona County Nonfarm Employment |
39,800 | 40,000 | 43,300 | -0.5 | -8.1 | ||
|
Selected U.S. Employment Data |
|||||||
|
U.S. Multiple Jobholders |
7,454,000 | 7,314,000 | 7,221,000 | 1.9 | 3.2 | ||
|
As a percent of all workers |
5.0% | 4.9% | 4.9% | N/A | N/A | ||
|
U.S. Discouraged Workers |
599,000 | 623,000 | 732,000 | -3.9 | -18.2 | ||
|
U.S. Part Time for Economic Reasons |
6,106,000 | 6,406,000 | 6,772,000 | -4.7 | -9.8 | ||
|
Wyoming Unemployment Insurance |
|||||||
|
Weeks Compensated |
29,447 | 26,441 | 19,638 | 11.4 | 49.9 | ||
|
Benefits Paid |
$11,745,479 | $10,492,866 | $7,420,775 | 11.9 | 58.3 | ||
|
Average Weekly Benefit Payment |
$398.87 | $396.84 | $377.88 | 0.5 | 5.6 | ||
|
State Insured Covered Jobs 1 |
264,665 | 264,479 | 266,686 | 0.1 | -0.8 | ||
|
Insured Unemployment Rate |
4.0% | 3.6% | 2.7% | N/A | N/A | ||
|
Consumer Price Index (U) for All U.S. Urban Consumers |
|||||||
|
(1982 to 1984 = 100) |
|||||||
|
All Items |
237.1 | 236.9 | 234.7 | 0.1 | 1.0 | ||
|
Food & Beverages
|
248.5 | 248.2 | 246.3 | 0.1 | 0.9 | ||
|
Housing |
241.0 | 240.4 | 236.0 | 0.2 | 2.1 | ||
|
Apparel |
125.6 | 121.9 | 124.5 | 3.0 | 0.9 | ||
|
Transportation |
187.3 | 190.2 | 193.9 | -1.5 | -3.4 | ||
|
Medical Care |
458.3 | 454.2 | 442.8 | 0.9 | 3.5 | ||
|
Recreation (Dec. 1997=100) |
116.6 | 116.1 | 115.6 | 0.5 | 0.9 | ||
|
Education & Communication (Dec. 1997=100)
|
139.2 | 139.5 | 137.6 | -0.2 | 1.2 | ||
|
Other Goods & Services
|
419.6 | 419.1 | 411.8 | 0.1 | 1.9 | ||
|
Producer Prices (1982 to 1984 = 100) |
|||||||
|
All Commodities |
181.5 | 182.5 | 191.1 | -0.5 | -5.0 | ||
|
Total Units |
89 | 93 | 98 | -4.3 | -9.2 | ||
|
Valuation |
$37,225,000 | $19,531,000 | $33,392,000 | 90.6 | 11.5 | ||
|
Single Family Homes |
87 | 65 | 95 | 33.8 | -8.4 | ||
|
Valuation |
$36,932,000 | $17,973,000 | $33,017,000 | 105.5 | 11.9 | ||
|
Casper MSA2Building Permits |
11 | 8 | 14 | 37.5 | -21.4 | ||
|
Valuation |
$2,469,000 | $1,982,000 | $3,054,000 | 24.6 | -19.2 | ||
|
Cheyenne MSA Building Permits |
13 | 21 | 19 | -38.1 | -31.6 | ||
|
Valuation |
$2,671,000 | $3,827,000 | $3,643,000 | -30.2 | -26.7 | ||
|
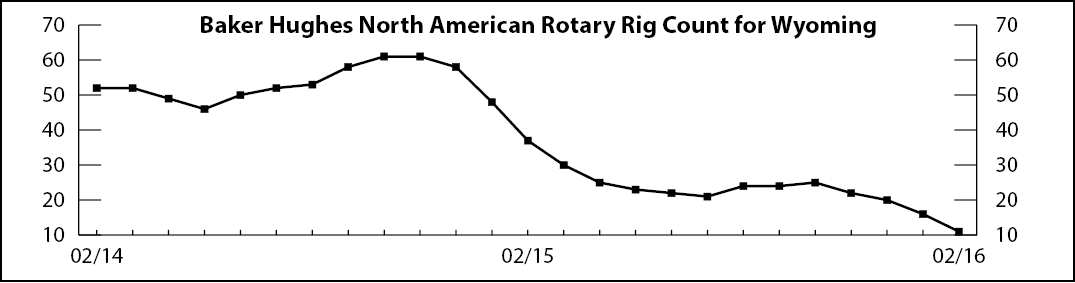
Baker Hughes North American Rotary Rig Count for Wyoming |
11 | 16 | 37 | -31.3 | -70.3 | ||