
Chapter 3: What Does Wyoming’s Unemployment Rate Really Mean?
Related Article: Unemployment Update: February 2016
Wyoming’s average annual unemployment rate for 2015 was 4.2%, up slightly from 4.1% in 2014 (not a significant change). This chapter explains how Wyoming’s unemployment rate remained relatively low in 2015, even with large job losses in Wyoming’s mining sector.
|
The Current Population Survey (CPS) is a monthly survey of households that the U.S. Census Bureau conducts in each state for the Bureau of Labor Statistics. Reviewing the detailed data underlying the total estimate of unemployment can provide clues as to the functioning of Wyoming’s labor market.
The drop in crude oil prices has caused job losses in the mining and related sectors, but these job losses don’t seem to be reflected in Wyoming’s unemployment rate in 2015. In order to be counted as unemployed in Wyoming, a worker has to reside in the state and must be available to work and actively looking for a job. Detailed tabulations from the CPS for Wyoming can help provide some insight as to why Wyoming’s unemployment rate remains low.
Data collected from the CPS include reasons why civilians are not in the labor force, reasons for unemployment, duration of unemployment, and full- and part-time work status. Due to the small Wyoming sample for the CPS, the data lack reliability on a monthly basis. Therefore, this chapter begins with a look at annual average data (12 months of labor force estimates divided by 12). Generalized sampling error information for the CPS annual average data for states can be found in appendix tables B-4 and B-5 of the Geographic Profile bulletin. Additional limitations of state data from the CPS can be found here. The data used in this chapter are unofficial, unpublished estimates from the CPS.
The labor force is the sum of employed and unemployed persons. People who are not in the labor force are those who do not have a job and are not looking for one. The unemployment rate is calculated by dividing the number of unemployed by the labor force. Therefore, if people leave Wyoming’s labor force, the unemployment rate might not drop as much as job losses would suggest. People might leave Wyoming’s labor force by moving out of state or by losing their job and not looking for a new one.
The CPS collects five reasons for unemployment (Bureau of Labor Statistics, 2006):
- Job losers include persons on temporary layoff, meaning they expect to return to work within six months, and permanent job losers, whose employment ended involuntarily and who began looking for work. In most cases, unemployment insurance (UI) claimants would be in the job loser category.
- Job leavers are persons who voluntarily quit their job and started looking for a new job.
- Persons who completed temporary jobs, and started looking for a new job when their previous job ended.
- Reentrants are persons who previously worked but who were out of the labor force prior to beginning their job search.
- New entrants are persons who have never worked.
Table 3.1 shows that on an annual average basis, the number of job losers increased from 4,800 to 5,600 from 2014 to 2015. Of those, 2,800 were permanent job losers in 2014. In 2015 this number rose to 3,400. These data are consistent with reports of layoffs in Wyoming’s oil & gas sector.
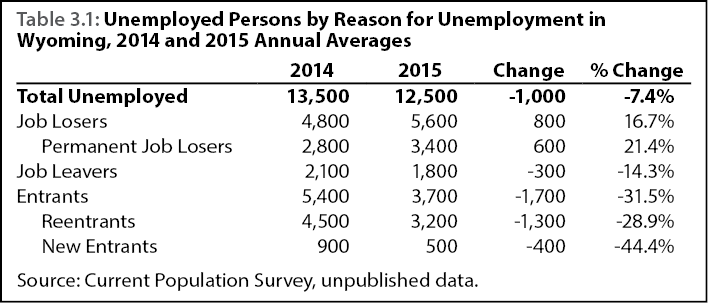
The number of entrants into the labor force was down from 5,400 in 2014 to 3,700 in 2015. This includes new entrants and reentrants.
Some individuals may be delaying entry or reentry into Wyoming’s labor market because they believe that there are few jobs available. Thus, while a downturn in the state’s economy can cause an increase in one component of unemployment (job losers), it may also be associated with decreases in other components (e.g. entrants). Additionally, some job losers may have moved to other states and no longer count in Wyoming’s labor force.

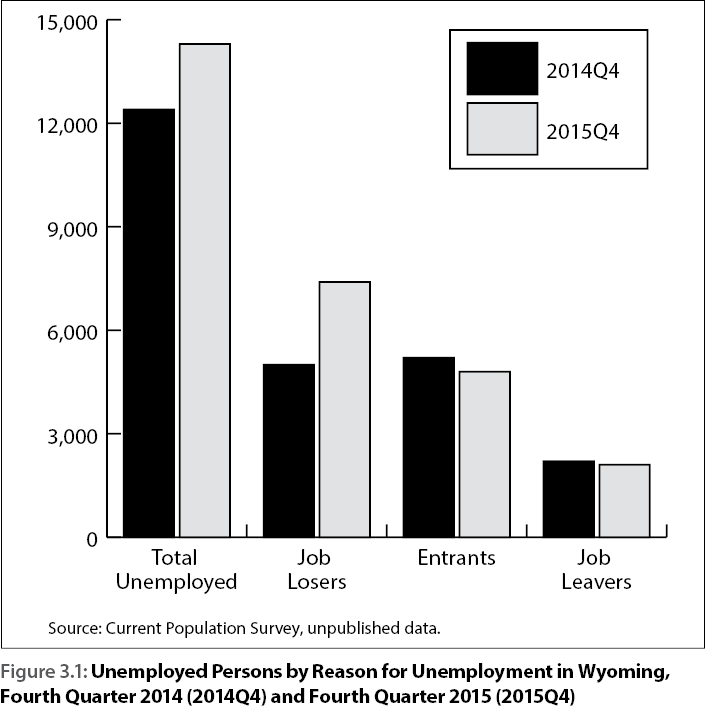
In contrast to Table 3.1, which shows averages for 12 months of 2014 and 2015, Table 3.2 focuses on the fourth quarter (October, November, and December). From fourth quarter 2014 (2014Q4) to fourth quarter 2015 (2015Q4), the estimated number of unemployed rose from 12,400 to 14,300, an increase of 1,900 people (15.3%). The number of unemployed individuals classified as job losers rose by 48.0%, while the number of job leavers (-4.5%) and entrants (-7.7%) decreased.
|
Figure 3.1 illustrates the data in a bar chart and shows that the largest increase from 2014Q4 to 2015Q4 was in the job loser category. This is consistent with a large increase in unemployment insurance (UI) claims in Wyoming. The number of continued UI weeks claimed rose from 19,747 in December 2014 to 27,479 in December 2015, an increase of 39.2% (Research & Planning, 2016).
In conclusion, it is widely known that the decrease in crude oil prices in 2015 contributed to large job losses in Wyoming’s energy sector. However, these job losses did not directly translate into an increase in the state’s unemployment rate, because the increase in job losers was partially offset by a decline in entrants. Even when the unemployment rate remains stable over time, the underlying components (job losers, entrants, and job leavers) can change dramatically, and changes in these components provide valuable clues as to the health of Wyoming’s labor market. The analysis presented in this article also supports the notion that similar unemployment rates can mean different things at different times in the business cycle. Individuals or programs that rely exclusively on a state’s unemployment rate as a measure of its economic condition face many risks, including completely misunderstanding the direction of the state’s economy (NASWA, 2015). All data users would be well-advised to review a cross-section of economic indicators when evaluating a state’s economy.
References
National Association of State Workforce Agencies. (2015). NASWA Recommendations to U.S. DOL on Implementation of the Performance Accountability Provisions of WIOA. Retrieved February 19, 2016, from http://www.naswa.org/assets/utilities/serve.cfm?gid=2C2CAE30-1781-4FB8-B674-CDD5B9F2CD95&dsp_meta=0
Research & Planning, Wyoming Department of Workforce Services. (2016). Statewide normalized continued weeks claimed by industry in NAICS. Retrieved February 22, 2016, from http://doe.state.wy.us/LMI/ui/NAICS_Statewide_Cont.htm
U.S. Bureau of Labor Statistics. (2006, February). Employment and earnings (February 2006), household data (‘‘A” tables, monthly; “D” tables, quarterly). Retrieved February 22, 2016, from http://www.bls.gov/cps/eetech_methods.pdf