Wyoming Unemployment Rate Unchanged at 4.0% in February 2015
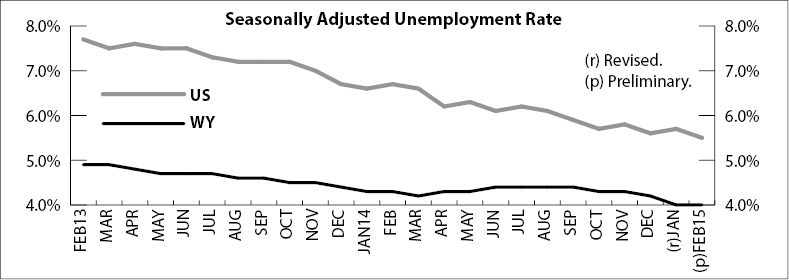
The Research & Planning section of the Wyoming Department of Workforce Services reported that the state’s seasonally adjusted1 unemployment rate held steady at 4.0% from January to February. Wyoming’s unemployment rate was slightly lower than its February 2014 level of 4.3% and significantly lower than the current U.S. unemployment rate of 5.5%. Seasonally adjusted employment of Wyoming residents was practically unchanged from January to February, rising by an estimated 80 individuals (0.0%). Wyoming’s labor force (the sum of employed and unemployed individuals) fell by 1,034 people (-0.3%) from a year earlier.
From January to February, most county unemployment rates changed very little. Unemployment rates fell in Laramie (down from 5.0% to 4.4%), Sheridan (down from 5.6% to 5.1%), Teton (down from 4.3% to 3.9%), and Goshen (down from 3.8% to 3.4%) counties. Unemployment rose in Sublette (up from 5.4% to 5.9%) and Uinta (up from 5.0% to 5.3%) counties.
From February 2014 to February 2015, unemployment rates fell in 17 counties and rose slightly in five counties. Johnson County’s unemployment rate was unchanged from a year earlier at 6.0%. The largest decreases occurred in Sheridan (down from 6.0% to 5.1%), Teton (down from 4.6% to 3.9%), Park (down from 6.0% to 5.3%), Laramie (down from 5.1% to 4.4%), and Big Horn (down from 5.7% to 5.0%) counties. Sublette County’s unemployment rate rose from 5.0% to 5.9%.
Niobrara County (3.3%) reported the lowest unemployment rate in February. It was followed by Goshen (3.4%), Albany (3.5%), and Converse (3.6%) counties. The highest unemployment rates were found in Lincoln (6.3%), Fremont (6.0%), Johnson (6.0%), and Sublette (5.9%) counties.
Total nonfarm employment (measured by place of work) rose from 282,500 in February 2014 to 286,500 in February 2015, a gain of 4,000 jobs (1.4%).
1Seasonal adjustment is a statistical procedure to remove the impact of normal regularly recurring events (such as weather, major holidays, and the opening and closing of schools) from economic time series to better understand changes in economic conditions from month to month.