|
Continued Claims
|
Continued
Weeks Claimed |
% Change Weeks Claimed
|
Feb
15 |
Feb
15 |
Feb
15 |
Jan
15 |
Feb
14 |
Jan
15 |
Feb
14 |
|
Wyoming Statewide
|
|
|
|
|
|
|
TOTAL WEEKS CLAIMED
|
24,997
|
23,362
|
26,602
|
7.0
|
-6.0
|
|
TOTAL UNIQUE CLAIMANTS
|
7,238
|
7,120
|
7,521
|
1.7
|
-3.8
|
|
Benefit Exhaustions
|
379
|
326
|
508
|
16.3
|
-25.4
|
|
Benefit Exhaustion Rates
|
5.2%
|
4.6%
|
6.8%
|
0.7%
|
-1.5%
|
|
TOTAL GOODS-PRODUCING
|
11,722
|
10,419
|
11,110
|
12.5
|
5.5
|
|
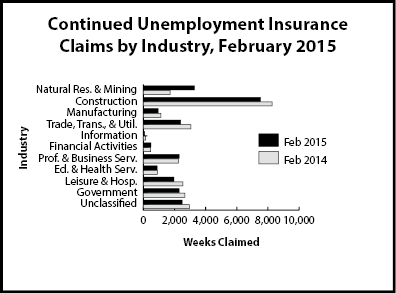
Natural Res. & Mining
|
3,267
|
1,746
|
1,715
|
87.1
|
90.5
|
|
Mining
|
3,087
|
1,553
|
1,520
|
98.8
|
103.1
|
|
Oil & Gas Extraction
|
261
|
132
|
149
|
97.7
|
75.2
|
|
Construction
|
7,508
|
7,803
|
8,269
|
-3.8
|
-9.2
|
|
Manufacturing
|
946
|
868
|
1,124
|
9.0
|
-15.8
|
|
TOTAL SERVICE-PROVIDING
|
8,500
|
8,199
|
9,877
|
3.7
|
-13.9
|
|
Trade, Transp., & Utilities
|
2,395
|
2,037
|
3,051
|
17.6
|
-21.5
|
|
Wholesale Trade
|
408
|
350
|
550
|
16.6
|
-25.8
|
|
Retail Trade
|
1,032
|
960
|
1,661
|
7.5
|
-37.9
|
|
Transp., Warehousing & Utilities
|
955
|
727
|
840
|
31.4
|
13.7
|
|
Information
|
81
|
79
|
137
|
2.5
|
-40.9
|
|
Financial Activities
|
484
|
379
|
470
|
27.7
|
3.0
|
|
Prof. & Business Services
|
2,294
|
2,055
|
2,245
|
11.6
|
2.2
|
|
Educational & Health Svcs.
|
877
|
989
|
901
|
-11.3
|
-2.7
|
|
Leisure & Hospitality
|
1,956
|
2,247
|
2,536
|
-13.0
|
-22.9
|
|
Other Svcs., exc. Public Admin.
|
407
|
408
|
530
|
-0.2
|
-23.2
|
|
TOTAL GOVERNMENT
|
2,291
|
2,244
|
2,668
|
2.1
|
-14.1
|
|
Federal Government
|
1,230
|
1,271
|
1,324
|
-3.2
|
-7.1
|
|
State Government
|
227
|
188
|
240
|
20.7
|
-5.4
|
|
Local Government
|
833
|
783
|
1,103
|
6.4
|
-24.5
|
|
Local Education
|
111
|
142
|
168
|
-21.8
|
-33.9
|
|
UNCLASSIFIED
|
2,482
|
2,499
|
2,945
|
-0.7
|
-15.7
|
|
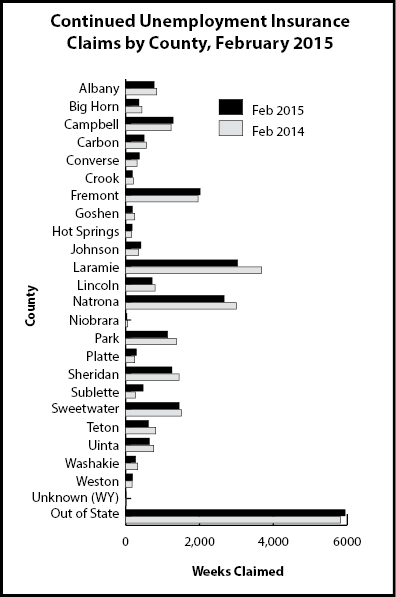
Laramie County
|
|
|
|
|
|
|
TOTAL WEEKS CLAIMED
|
3,034
|
3,307
|
3,682
|
-8.3
|
-17.6
|
|
TOTAL UNIQUE CLAIMANTS
|
880
|
1,012
|
1,045
|
-13.0
|
-15.8
|
|
TOTAL GOODS-PRODUCING
|
1,444
|
1,763
|
1,886
|
-18.1
|
-23.4
|
|
Construction
|
1,172
|
1,480
|
1,700
|
-20.8
|
-31.1
|
|
TOTAL SERVICE-PROVIDING
|
1,224
|
1,210
|
1,518
|
1.2
|
-19.4
|
|
Trade, Transp., & Utilities
|
381
|
329
|
523
|
15.8
|
-27.2
|
|
Financial Activities
|
79
|
80
|
85
|
-1.3
|
-7.1
|
|
Prof. & Business Svcs.
|
448
|
416
|
557
|
7.7
|
-19.6
|
|
Educational & Health Svcs.
|
245
|
247
|
155
|
-0.8
|
58.1
|
|
Leisure & Hospitality
|
108
|
151
|
183
|
-28.5
|
-41.0
|
|
TOTAL GOVERNMENT
|
235
|
219
|
226
|
7.3
|
4.0
|
|
UNCLASSIFIED
|
129
|
113
|
50
|
14.2
|
158.0
|
|
Natrona County
|
|
|
|
|
|
|
TOTAL WEEKS CLAIMED
|
2,665
|
2,454
|
2,999
|
8.6
|
-11.1
|
|
TOTAL UNIQUE CLAIMANTS
|
807
|
769
|
869
|
4.9
|
-7.1
|
|
TOTAL GOODS-PRODUCING
|
1,359
|
1,244
|
1,485
|
9.2
|
-8.5
|
|
Construction
|
729
|
904
|
1,043
|
-19.4
|
-30.1
|
|
TOTAL SERVICE-PROVIDING
|
1,095
|
1,028
|
1,322
|
6.5
|
-17.2
|
|
Trade, Transp., & Utilities
|
350
|
307
|
448
|
14.0
|
-21.9
|
|
Financial Activities
|
53
|
44
|
66
|
20.5
|
-19.7
|
|
Professional & Business Svcs.
|
403
|
369
|
366
|
9.2
|
10.1
|
|
Educational & Health Svcs.
|
170
|
194
|
208
|
-12.4
|
-18.3
|
|
Leisure & Hospitality
|
126
|
124
|
195
|
1.6
|
-35.4
|
|
TOTAL GOVERNMENT
|
108
|
93
|
121
|
16.1
|
-10.7
|
|
UNCLASSIFIED
|
101
|
87
|
70
|
16.1
|
44.3
|
| aAn average month is considered 4.33 weeks. If a month has four weeks, the normalization factor is 1.0825. If the month has five weeks, the normalization factor is 0.866. The number of raw claims is multiplied by the normalization factor to achieve the normalized claims counts. |
|
Continued Claims by Industry
Continued Claims by County
|
