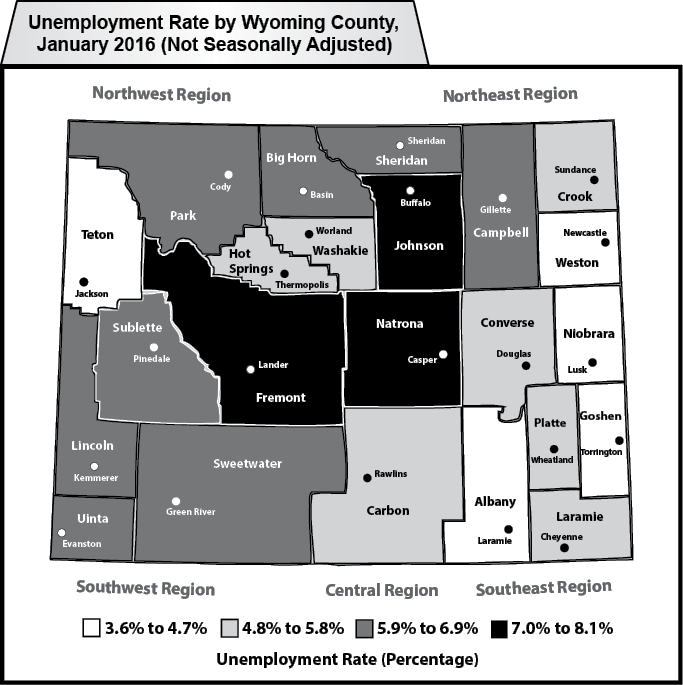
Wyoming County Unemployment Rates
Most county unemployment rates followed their normal seasonal pattern and increased from December to January.
| Labor Force | Employed | Unemployed | Unemployment Rates | |||||||||
|---|---|---|---|---|---|---|---|---|---|---|---|---|
| REGION | Jan | Dec | Jan | Jan | Dec | Jan | Jan | Dec | Jan | Jan | Dec | Jan |
| County | 2016 | 2015 | 2015 | 2016 | 2015 | 2015 | 2016 | 2015 | 2015 | 2016 | 2015 | 2015 |
| (p) | (r) | (b) | (p) | (r) | (b) | (p) | (r) | (b) | (p) | (r) | (b) | |
|
NORTHWEST
|
47,155 | 47,409 | 47,290 | 43,892 | 44,888 | 44,704 | 3,263 | 2,521 | 2,586 | 6.9 | 5.3 | 5.5 |
|
Big Horn
|
5,367 | 5,414 | 5,430 | 5,045 | 5,152 | 5,170 | 322 | 262 | 260 | 6.0 | 4.8 | 4.8 |
|
Fremont
|
20,224 | 20,223 | 20,396 | 18,591 | 18,988 | 19,174 | 1,633 | 1,235 | 1,222 | 8.1 | 6.1 | 6.0 |
|
Hot Springs
|
2,341 | 2,369 | 2,383 | 2,207 | 2,269 | 2,278 | 134 | 100 | 105 | 5.7 | 4.2 | 4.4 |
|
Park
|
14,964 | 15,073 | 14,802 | 14,017 | 14,321 | 14,001 | 947 | 752 | 801 | 6.3 | 5.0 | 5.4 |
|
Washakie
|
4,259 | 4,330 | 4,279 | 4,032 | 4,158 | 4,081 | 227 | 172 | 198 | 5.3 | 4.0 | 4.6 |
|
NORTHEAST
|
52,483 | 52,724 | 53,965 | 49,341 | 50,393 | 51,582 | 3,142 | 2,331 | 2,383 | 6.0 | 4.4 | 4.4 |
|
Campbell
|
25,232 | 25,444 | 26,417 | 23,728 | 24,314 | 25,461 | 1,504 | 1,130 | 956 | 6.0 | 4.4 | 3.6 |
|
Crook
|
3,599 | 3,565 | 3,660 | 3,409 | 3,429 | 3,501 | 190 | 136 | 159 | 5.3 | 3.8 | 4.3 |
|
Johnson
|
4,029 | 4,020 | 4,202 | 3,743 | 3,813 | 3,946 | 286 | 207 | 256 | 7.1 | 5.1 | 6.1 |
|
Sheridan
|
15,729 | 15,747 | 15,711 | 14,731 | 15,021 | 14,856 | 998 | 726 | 855 | 6.3 | 4.6 | 5.4 |
|
Weston
|
3,894 | 3,948 | 3,975 | 3,730 | 3,816 | 3,818 | 164 | 132 | 157 | 4.2 | 3.3 | 3.9 |
|
SOUTHWEST
|
58,486 | 59,074 | 60,169 | 55,104 | 56,193 | 57,381 | 3,382 | 2,881 | 2,788 | 5.8 | 4.9 | 4.6 |
|
Lincoln
|
8,246 | 8,250 | 8,260 | 7,730 | 7,848 | 7,762 | 516 | 402 | 498 | 6.3 | 4.9 | 6.0 |
|
Sublette
|
4,521 | 4,368 | 4,845 | 4,215 | 4,118 | 4,588 | 306 | 250 | 257 | 6.8 | 5.7 | 5.3 |
|
Sweetwater
|
22,359 | 22,744 | 23,195 | 20,913 | 21,586 | 22,194 | 1,446 | 1,158 | 1,001 | 6.5 | 5.1 | 4.3 |
|
Teton
|
14,082 | 14,221 | 14,039 | 13,566 | 13,655 | 13,468 | 516 | 566 | 571 | 3.7 | 4.0 | 4.1 |
|
Uinta
|
9,278 | 9,491 | 9,830 | 8,680 | 8,986 | 9,369 | 598 | 505 | 461 | 6.4 | 5.3 | 4.7 |
|
SOUTHEAST
|
82,836 | 84,086 | 82,251 | 79,060 | 80,999 | 78,630 | 3,776 | 3,087 | 3,621 | 4.6 | 3.7 | 4.4 |
|
Albany
|
21,110 | 21,889 | 20,363 | 20,346 | 21,259 | 19,614 | 764 | 630 | 749 | 3.6 | 2.9 | 3.7 |
|
Goshen
|
7,086 | 7,224 | 7,062 | 6,813 | 6,999 | 6,800 | 273 | 225 | 262 | 3.9 | 3.1 | 3.7 |
|
Laramie
|
48,501 | 48,877 | 48,761 | 46,080 | 46,891 | 46,408 | 2,421 | 1,986 | 2,353 | 5.0 | 4.1 | 4.8 |
|
Niobrara
|
1,269 | 1,257 | 1,315 | 1,215 | 1,221 | 1,270 | 54 | 36 | 45 | 4.3 | 2.9 | 3.4 |
|
Platte
|
4,870 | 4,839 | 4,750 | 4,606 | 4,629 | 4,538 | 264 | 210 | 212 | 5.4 | 4.3 | 4.5 |
|
CENTRAL
|
58,677 | 58,963 | 60,416 | 54,755 | 55,891 | 57,889 | 3,922 | 3,072 | 2,527 | 6.7 | 5.2 | 4.2 |
|
Carbon
|
8,639 | 8,609 | 8,088 | 8,182 | 8,270 | 7,730 | 457 | 339 | 358 | 5.3 | 3.9 | 4.4 |
|
Converse
|
8,294 | 8,255 | 8,398 | 7,823 | 7,894 | 8,113 | 471 | 361 | 285 | 5.7 | 4.4 | 3.4 |
|
Natrona
|
41,744 | 42,099 | 43,930 | 38,750 | 39,727 | 42,046 | 2,994 | 2,372 | 1,884 | 7.2 | 5.6 | 4.3 |
|
STATEWIDE
|
299,636 | 302,254 | 304,089 | 282,151 | 288,362 | 290,185 | 17,485 | 13,892 | 13,904 | 5.8 | 4.6 | 4.6 |
|
Statewide Seasonally Adjusted
|
4.7 | 4.4 | 3.8 | |||||||||
|
U.S.
|
5.3 | 4.8 | 6.1 | |||||||||
|
U.S. Seasonally Adjusted
|
4.9 | 5.0 | 5.7 | |||||||||
|
Prepared in cooperation with the Bureau of Labor Statistics. Benchmarked 03/2016. Run Date 03/2016. Data are not seasonally adjusted except where otherwise specified. (p) Preliminary. (r) Revised. (b) Benchmarked. |
||||||||||||
|
| ||||||||||||