Initial Claims
|
Claims
Filed |
Percent
Change
Claims Filed |
Jan
15 |
Jan
15 |
Jan
15 |
Dec
14 |
Jan
14 |
Dec
14 |
Jan
14 |
|
Wyoming Statewide
|
|
TOTAL CLAIMS FILED
|
4,025
|
3,218
|
3,636
|
25.1
|
10.7
|
|
TOTAL GOODS-PRODUCING
|
2,160
|
1,686
|
1,691
|
28.1
|
27.7
|
|
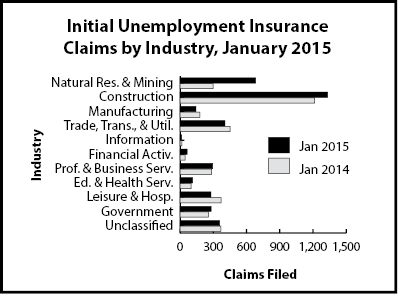
Natural Res. & Mining
|
682
|
264
|
297
|
158.3
|
129.6
|
|
Mining
|
658
|
243
|
272
|
170.8
|
141.9
|
|
Oil & Gas Extraction
|
51
|
14
|
12
|
264.3
|
325.0
|
|
Construction
|
1,333
|
1,318
|
1,214
|
1.1
|
9.8
|
|
Manufacturing
|
143
|
103
|
178
|
38.8
|
-19.7
|
|
TOTAL SERVICE-PROVIDING
|
1,228
|
982
|
1,321
|
25.1
|
-7.0
|
|
Trade, Transp., & Utilities
|
403
|
315
|
451
|
27.9
|
-10.6
|
|
Wholesale Trade
|
62
|
44
|
85
|
40.9
|
-27.1
|
|
Retail Trade
|
172
|
116
|
249
|
48.3
|
-30.9
|
|
Transp., Warehousing & Utilities
|
169
|
155
|
117
|
9.0
|
44.4
|
|
Information
|
14
|
11
|
16
|
27.3
|
-12.5
|
|
Financial Activities
|
62
|
32
|
44
|
93.8
|
40.9
|
|
Prof. and Business Svcs.
|
293
|
228
|
285
|
28.5
|
2.8
|
|
Educational & Health Svcs.
|
112
|
119
|
100
|
-5.9
|
12.0
|
|
Leisure & Hospitality
|
277
|
215
|
370
|
28.8
|
-25.1
|
|
Other Svcs., exc. Public Admin.
|
61
|
54
|
47
|
13.0
|
29.8
|
|
TOTAL GOVERNMENT
|
279
|
219
|
256
|
27.4
|
9.0
|
|
Federal Government
|
126
|
135
|
119
|
-6.7
|
5.9
|
|
State Government
|
33
|
12
|
20
|
175.0
|
65.0
|
|
Local Government
|
119
|
71
|
116
|
67.6
|
2.6
|
|
Local Education
|
16
|
15
|
26
|
6.7
|
-38.5
|
|
UNCLASSIFIED
|
357
|
329
|
367
|
8.5
|
-2.7
|
|
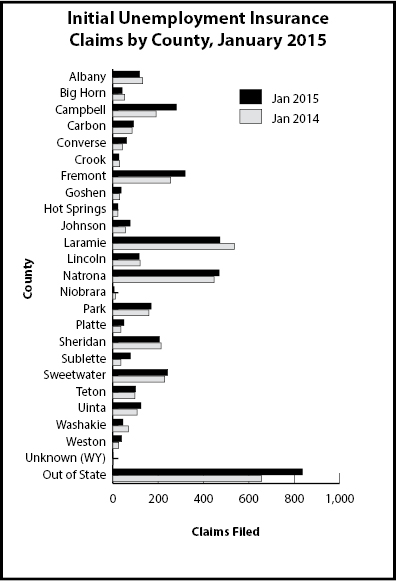
Laramie County
|
|
|
|
|
|
|
TOTAL CLAIMS FILED
|
471
|
562
|
536
|
-16.2
|
-12.1
|
|
TOTAL GOODS-PRODUCING
|
230
|
341
|
291
|
-32.6
|
-21.0
|
|
Construction
|
185
|
296
|
253
|
-37.5
|
-26.9
|
|
TOTAL SERVICE-PROVIDING
|
189
|
183
|
207
|
3.3
|
-8.7
|
|
Trade, Transp., & Utilities
|
63
|
74
|
82
|
-14.9
|
-23.2
|
|
Financial Activities
|
11
|
8
|
3
|
37.5
|
266.7
|
|
Prof. & Business Svcs.
|
62
|
31
|
77
|
100.0
|
-19.5
|
|
Educational & Health Svcs.
|
32
|
28
|
15
|
14.3
|
113.3
|
|
Leisure & Hospitality
|
25
|
29
|
38
|
-13.8
|
-34.2
|
|
TOTAL GOVERNMENT
|
29
|
19
|
25
|
52.6
|
16.0
|
|
UNCLASSIFIED
|
22
|
18
|
11
|
22.2
|
100.0
|
|
Natrona County
|
|
|
|
|
|
|
TOTAL CLAIMS FILED
|
468
|
415
|
446
|
12.8
|
4.9
|
|
TOTAL GOODS-PRODUCING
|
274
|
235
|
236
|
16.6
|
16.1
|
|
Construction
|
162
|
180
|
169
|
-10.0
|
-4.1
|
|
TOTAL SERVICE-PROVIDING
|
165
|
154
|
188
|
7.1
|
-12.2
|
|
Trade, Transp., & Utilities
|
70
|
51
|
76
|
37.3
|
-7.9
|
|
Financial Activities
|
8
|
1
|
6
|
700.0
|
33.3
|
|
Prof. & Business Svcs.
|
46
|
56
|
51
|
-17.9
|
-9.8
|
|
Educational & Health Svcs.
|
19
|
25
|
24
|
-24.0
|
-20.8
|
|
Leisure & Hospitality
|
18
|
18
|
32
|
0.0
|
-43.8
|
|
TOTAL GOVERNMENT
|
11
|
13
|
10
|
-15.4
|
10.0
|
|
UNCLASSIFIED
|
16
|
12
|
11
|
33.3
|
45.5
|