Wyoming Normalizeda Unemployment Insurance Statistics: Continued Claims
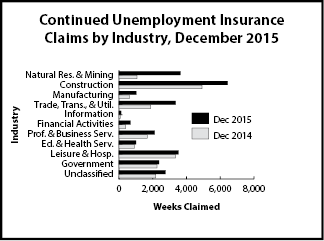
Over the year, the number of unique claimants with continued claims increased 37.1%. Continued weeks claimed increased 39.2%. Mining experienced the largest percentage increase in weeks claimed (291.7%).
|
Continued Claims |
Continued Weeks Claimed | % Change Weeks Claimed | ||||
|---|---|---|---|---|---|---|
|
Dec 15 |
Dec 15 |
|||||
|
Dec 15 |
Nov 15 |
Dec 14 |
Nov 15 |
Dec 14 |
||
| Wyoming Statewide | ||||||
|
TOTAL WEEKS CLAIMED |
27,479 | 21,603 | 19,747 | 27.2 | 39.2 | |
|
TOTAL UNIQUE CLAIMANTSb
|
7,017 | 6,415 | 5,117 | 9.4 | 37.1 | |
|
Benefit Exhaustions |
464 | 396 | 273 | 17.2 | 70.0 | |
|
Benefit Exhaustion Rates |
6.6% | 6.2% | 5.3% | 0.4% | 1.3% | |
|
TOTAL GOODS-PRODUCING |
11,097 | 7,265 | 6,617 | 52.7 | 67.7 | |
|
Natural Res. & Mining
|
3,636 | 3,205 | 1,069 | 13.4 | 240.1 | |
|
Mining |
3,474 | 3,124 | 887 | 11.2 | 291.7 | |
|
Oil & Gas Extraction
|
492 | 362 | 127 | 35.9 | 287.4 | |
|
Construction |
6,437 | 3,137 | 4,930 | 105.2 | 30.6 | |
|
Manufacturing |
1,022 | 923 | 616 | 10.7 | 65.9 | |
|
TOTAL SERVICE-PROVIDING |
11,259 | 10,749 | 8,690 | 4.7 | 29.6 | |
|
Trade, Transp., & Utilities
|
3,356 | 2,952 | 1,885 | 13.7 | 78.0 | |
|
Wholesale Trade |
835 | 780 | 309 | 7.1 | 170.2 | |
|
Retail Trade |
1,166 | 1,114 | 872 | 4.7 | 33.7 | |
|
Transp., Warehousing & Utilities
|
1,355 | 1,058 | 704 | 28.1 | 92.5 | |
|
Information |
124 | 146 | 75 | -15.1 | 65.3 | |
|
Financial Activities |
684 | 553 | 410 | 23.7 | 66.8 | |
|
Prof. & Business Services
|
2,119 | 1,622 | 1,681 | 30.6 | 26.1 | |
|
Educational & Health Svcs.
|
1,007 | 993 | 922 | 1.4 | 9.2 | |
|
Leisure and Hospitality |
3,525 | 4,087 | 3,356 | -13.8 | 5.0 | |
|
Other Svcs., exc. Public Admin. |
436 | 388 | 355 | 12.4 | 22.8 | |
|
TOTAL GOVERNMENT |
2,368 | 1,691 | 2,262 | 40.0 | 4.7 | |
|
Federal Government |
1,206 | 759 | 1,328 | 58.9 | -9.2 | |
|
State Government |
229 | 203 | 188 | 12.8 | 21.8 | |
|
Local Government |
932 | 728 | 745 | 28.0 | 25.1 | |
|
Local Education |
174 | 199 | 115 | -12.6 | 51.3 | |
|
UNCLASSIFIED |
2,753 | 1,896 | 2,177 | 45.2 | 26.5 | |
|
Laramie County |
||||||
|
TOTAL WEEKS CLAIMED |
2,804 | 1,819 | 2,550 | 54.2 | 10.0 | |
|
TOTAL UNIQUE CLAIMANTS |
753 | 557 | 689 | 35.2 | 9.3 | |
|
TOTAL GOODS-PRODUCING |
1,376 | 558 | 1,126 | 146.6 | 22.2 | |
|
Construction |
1,116 | 422 | 935 | 164.5 | 19.4 | |
|
TOTAL SERVICE-PROVIDING |
1,080 | 996 | 1,114 | 8.4 | -3.1 | |
|
Trade, Transp., and Utilities |
426 | 318 | 316 | 34.0 | 34.8 | |
|
Financial Activities |
112 | 115 | 90 | -2.6 | 24.4 | |
|
Prof. & Business Svcs.
|
271 | 295 | 336 | -8.1 | -19.3 | |
|
Educational and Health Svcs. |
163 | 172 | 242 | -5.2 | -32.6 | |
|
Leisure & Hospitality
|
102 | 97 | 121 | 5.2 | -15.7 | |
|
TOTAL GOVERNMENT |
222 | 179 | 226 | 24.0 | -1.8 | |
|
UNCLASSIFIED |
123 | 84 | 82 | 46.4 | 50.0 | |
|
Natrona County |
||||||
|
TOTAL WEEKS CLAIMED |
4,116 | 3,288 | 1,870 | 25.2 | 120.1 | |
|
TOTAL UNIQUE CLAIMANTS |
1,050 | 954 | 497 | 10.1 | 111.3 | |
|
TOTAL GOODS-PRODUCING |
1,938 | 1,483 | 823 | 30.7 | 135.5 | |
|
Construction |
901 | 408 | 620 | 120.8 | 45.3 | |
|
TOTAL SERVICE-PROVIDING |
1,977 | 1,646 | 904 | 20.1 | 118.7 | |
|
Trade, Transp., and Utilities |
777 | 671 | 265 | 15.8 | 193.2 | |
|
Financial Activities |
169 | 142 | 36 | 19.0 | 369.4 | |
|
Professional & Business Svcs.
|
370 | 254 | 248 | 45.7 | 49.2 | |
|
Educational & Health Svcs.
|
176 | 182 | 177 | -3.3 | -0.6 | |
|
Leisure & Hospitality
|
317 | 264 | 97 | 20.1 | 226.8 | |
|
TOTAL GOVERNMENT |
98 | 82 | 73 | 19.5 | 34.2 | |
|
UNCLASSIFIED |
100 | 76 | 68 | 31.6 | 47.1 | |
| aAn average month is considered 4.33 weeks. If a month has four weeks, the normalization factor is 1.0825. If the month has five weeks, the normalization factor is 0.866. The number of raw claims is multiplied by the normalization factor to achieve the normalized claims counts. bDoes not include claimants receiving extended benefits. |
||||||
Continued Claims by Industry
Continued Claims by County |
||||||

