Wyoming Normalizeda Unemployment Insurance Statistics: Initial Claims
by: Sherry Wen, Principal Economist
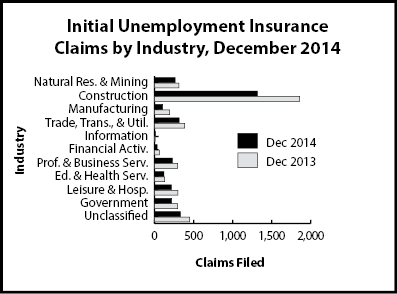
Initial claims decreased 25.8% over the year. The only over-the-year increases were seen in information (37.5%), an industry with a small number of claims, and other services, except public administration (1.9%).
|
Initial Claims |
Claims Filed
|
Percent Change Claims Filed
|
|
Dec 14
|
Dec 14
|
|
Dec 14
|
Nov 14
|
Dec 13
|
Nov 14
|
Dec 13
|
|
Wyoming Statewide
|
|
|
|
|
|
|
TOTAL CLAIMS FILED
|
3,218
|
3,772
|
4,339
|
-14.7
|
-25.8
|
|
TOTAL GOODS-PRODUCING
|
1,686
|
1,726
|
2,362
|
-2.3
|
-28.6
|
|
Natural Res. & Mining
|
264
|
179
|
310
|
47.5
|
-14.8
|
|
Mining
|
243
|
155
|
289
|
56.8
|
-15.9
|
|
Oil & Gas Extraction
|
14
|
12
|
20
|
16.7
|
-30.0
|
|
Construction
|
1,318
|
1,441
|
1,859
|
-8.5
|
-29.1
|
|
Manufacturing
|
103
|
103
|
191
|
0.0
|
-46.1
|
|
TOTAL SERVICE-PROVIDING
|
982
|
1,315
|
1,232
|
-25.3
|
-20.3
|
|
Trade, Transp., & Utilities
|
315
|
275
|
384
|
14.5
|
-18.0
|
|
Wholesale Trade
|
44
|
41
|
54
|
7.3
|
-18.5
|
|
Retail Trade
|
116
|
137
|
167
|
-15.3
|
-30.5
|
|
Transp., Warehousing & Utilities
|
155
|
97
|
163
|
59.8
|
-4.9
|
|
Information
|
11
|
8
|
8
|
37.5
|
37.5
|
|
Financial Activities
|
32
|
51
|
60
|
-37.3
|
-46.7
|
|
Prof. and Business Svcs.
|
228
|
275
|
294
|
-17.1
|
-22.4
|
|
Educational & Health Svcs.
|
119
|
105
|
129
|
13.3
|
-7.8
|
|
Leisure & Hospitality
|
215
|
552
|
299
|
-61.1
|
-28.1
|
|
Other Svcs., exc. Public Admin.
|
54
|
43
|
53
|
25.6
|
1.9
|
|
TOTAL GOVERNMENT
|
219
|
339
|
294
|
-35.4
|
-25.5
|
|
Federal Government
|
135
|
239
|
155
|
-43.5
|
-12.9
|
|
State Government
|
12
|
18
|
24
|
-33.3
|
-50.0
|
|
Local Government
|
71
|
82
|
113
|
-13.4
|
-37.2
|
|
Local Education
|
15
|
10
|
24
|
50.0
|
-37.5
|
|
UNCLASSIFIED
|
329
|
390
|
450
|
-15.6
|
-26.9
|
|
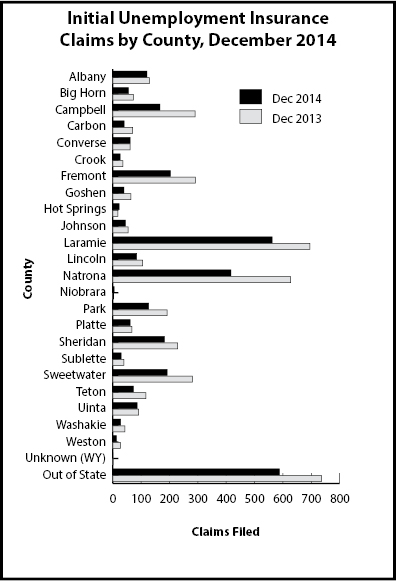
Laramie County
|
|
|
|
|
|
|
TOTAL CLAIMS FILED
|
562
|
572
|
694
|
-1.7
|
-19.0
|
|
TOTAL GOODS-PRODUCING
|
341
|
389
|
448
|
-12.3
|
-23.9
|
|
Construction
|
296
|
364
|
409
|
-18.7
|
-27.6
|
|
TOTAL SERVICE-PROVIDING
|
183
|
140
|
210
|
30.7
|
-12.9
|
|
Trade, Transp., & Utilities
|
74
|
42
|
74
|
76.2
|
0.0
|
|
Financial Activities
|
8
|
8
|
13
|
0.0
|
-38.5
|
|
Prof. & Business Svcs.
|
31
|
49
|
62
|
-36.7
|
-50.0
|
|
Educational & Health Svcs.
|
28
|
28
|
17
|
0.0
|
64.7
|
|
Leisure & Hospitality
|
29
|
12
|
34
|
141.7
|
-14.7
|
|
TOTAL GOVERNMENT
|
19
|
22
|
25
|
-13.6
|
-24.0
|
|
UNCLASSIFIED
|
18
|
19
|
10
|
-5.3
|
80.0
|
|
Natrona County
|
|
|
|
|
|
|
TOTAL CLAIMS FILED
|
415
|
398
|
626
|
4.3
|
-33.7
|
|
TOTAL GOODS-PRODUCING
|
235
|
254
|
404
|
-7.5
|
-41.8
|
|
Construction
|
180
|
225
|
312
|
-20.0
|
-42.3
|
|
TOTAL SERVICE-PROVIDING
|
154
|
123
|
197
|
25.2
|
-21.8
|
|
Trade, Transp., & Utilities
|
51
|
33
|
60
|
54.5
|
-15.0
|
|
Financial Activities
|
1
|
7
|
4
|
-85.7
|
-75.0
|
|
Prof. & Business Svcs.
|
56
|
40
|
53
|
40.0
|
5.7
|
|
Educational & Health Svcs.
|
25
|
19
|
32
|
31.6
|
-21.9
|
|
Leisure & Hospitality
|
18
|
19
|
40
|
-5.3
|
-55.0
|
|
TOTAL GOVERNMENT
|
13
|
9
|
15
|
44.4
|
-13.3
|
|
UNCLASSIFIED
|
12
|
10
|
9
|
20.0
|
33.3
|
|
Initial Claims by Industry
Initial Claims by County
|
