
The Survey of Occupational Injuries and Illnesses for 2013
This article summarizes the 2013 Wyoming Survey of Occupational Injuries and Illnesses results. The data include estimates of incidence rates by industry and the nature of the injury or illness. Also included are some worker demographics, such as age and gender. State and local government data are discussed briefly. An estimated 2,390 nonfatal occupational injury and illness cases with days away from work occurred in private industry in Wyoming in 2013, with an incidence rate of 3.4.
The Research & Planning (R&P) section of the Wyoming Department of Workforce Services annually conducts the Survey of Occupational Injuries and Illnesses (SOII) for Wyoming in cooperation with the U.S. Bureau of Labor Statistics (BLS) as part of a nationwide data collection effort. The survey data identify the estimated incidence rates (see Definitions) of work-related injuries and illnesses at the industry level. Detailed characteristics of severe injuries and illnesses (those that result in days away from work) are also identified. For 2013, cases with job transfer or restriction for the following six private North American Industry Classification System (NAICS) sectors will also have demographic and injury/illness characteristics provided by employers:
- 238 – Specialty trade contractors
- 311 – Food manufacturing
- 444 – Building materials & garden equipment supplies dealers
- 481 – Air transportation
- 493 – Warehousing & storage
- 623 – Nursing & residential care facilities
The data for the cases with days away from work can be used by employers and safety awareness groups to focus on prevention. The data are also used by regulatory agencies for tracking injury and illness trends, and to target safety resources.
Wyoming had an estimated 2,390 occupational injury and illness cases with days away from work in private industry for 2013.
Background and Methodology
For this mandatory survey (see Definitions), 2,377 private and 323 public sector (state and local government) Wyoming employers were notified in December 2012 to keep records of their firms’ work-related injuries and illnesses during calendar year (CY) 2013 using the Occupational Safety & Health Administration (OSHA) 300 forms. Along with data from the original firms sampled, occupational injury and illness data for 184 employers from the mining, except oil & gas; and railroad industries were added from administrative records provided to BLS by two federal agencies: the U.S. Department of Labor, Mine Safety & Health Administration (MSHA) and the U.S. Department of Transportation, Federal Railroad Administration (FRA). In January of 2014, public and private employers were sent a pamphlet describing how to transfer data from the OSHA 300 forms to questionnaires available on the Internet or by e-mail.
Employers were asked to respond within 30 days. Two subsequent mailings were sent to non-respondents to increase response rates, after which attempts were made to contact these employers by phone or e-mail to acquire the information. Employers were also contacted to verify or correct data. The data collection periods lasted approximately seven months. After the data collection periods, data and results were reviewed by state, regional and national BLS staff and incidence rates calculated.
About 11.0% of the 2,700 original sampled units were determined to be out of scope, had gone out of business since the sample was drawn, had a duplicate record, had no employees in 2013, or otherwise did not meet the criteria for inclusion in the survey. Of the remaining sampled and BLS-provided employers, 91% in 2013 provided useable responses for the survey.
Data were reported by employers on the basis of a single incident or occurrence. If an employee experienced more than one nonfatal work-related injury or illness during the calendar year, each incident was reported separately and is referred to as a case. If an incident injured more than one employee, each employee was reported separately on the questionnaire. For a work-related injury/illness to be categorized as a recordable case, it results in any of the following:
- death
- days away from work
- restricted work or transfer to another job
- medical treatment beyond first aid, or loss of consciousness
- a significant injury or illness diagnosed by a physician or other licensed health care professional, even if it does not result in death, days away from work, restricted work or job transfer.
For additional information see the OSHA Recordkeeping Rules online.
Data reported by employers to Worker’s Compensation have a higher number of work-related injuries and illnesses due to having different definitions and requirements than the SOII does. R&P provides data on the number of Worker’s Compensation cases by quarter and historically, which can be found near the bottom of the page at: http://doe.state.wy.us/LMI/safety.htm.
Due to the discrepancies in the numbers of work-related injuries and illnesses reported by both Worker’s Compensation and the SOII, there has been and continues to be research into this undercount. Information on the undercount can be found at: http://www.bls.gov/iif/oshfaq1.htm#q02.
The BLS produces the SOII incidence rate estimates from the gathered data. Incidence rates by industry indicate the number of nonfatal occupational illnesses or injuries per 100 full-time employees. The cases deemed the most serious are those which involve days away from work (DAFW). The BLS counts up to a cap of 180 days away from work per case, even though there are cases with more days. DAFW cases associated with employees who do not require time off work beyond the day of injury are not included as DAFW cases. The number of cases with days of restricted duty or job transfer (DJTR) is counted in the summary of injuries and/or illnesses. Other recordable cases are also counted in the summary of injuries and/or illnesses, which are cases requiring medical treatment beyond first aid but with no lost time, restricted duty, or job transfer days.
Incidence Rates
The total estimated incidence rate in Wyoming for all ownerships was 3.5 injuries and illnesses per 100 full-time employees in 2013. The private sector estimated incidence rate was 3.4. The rate for state and local government was 4.2 for 2013. For state government alone, the rate was 2.8; for local government alone, the rate was 4.7.
 |
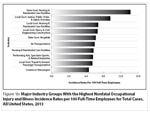 |
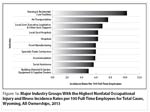
Figures 1a and 1b show the top 10 industry subsectors in all ownerships with high estimated incidence rates (or those with higher risk) in Wyoming and the United States, respectively for 2013. Two of the 10 top industry subsectors nationally were also found in Wyoming’s top 10 for 2013. These were air transportation and nursing & residential care facilities. The eight higher risk industry sectors that were unique to Wyoming were local government-executive, legislative & other government support; local government-hospitals, private-hospitals; specialty trade contractors; food manufacturing; accommodation; social assistance; and building material & garden equipment & supplies dealers.
The relative standard error (RSE; see Definitions) computed by BLS was used to calculate the estimates, with a 95% confidence interval. The tables with the RSE’s are available upon request from R&P.
Case and Demographic Data
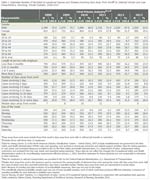 |
Table 1 shows the number of nonfatal occupational injuries and illnesses by selected characteristics for Wyoming from 2008 to 2013. These data show only cases with days away from work; they do not include cases that resulted solely in job transfer or restricted duty or those that were other recordable cases. There appears to be a general downward trend in the number of cases for each category over the years.
Worker Characteristics
In 2013, males made up 55.6% of Wyoming’s workforce (BLS-1, 2014). In the total of DAFW cases in 2013, 63.6% involved males. This contrasts with the Census of Fatal Occupational Injuries & Illnesses (CFOI) data showing that 96.2% of Wyoming CFOI fatalities in 2013 were males (CFOI, 2014). Females made up 44.0% of the workforce in Wyoming (BLS-1, 2014), but only 35.6% of workers who became more seriously injured or ill at work in 2013 were females.1
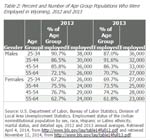 |
Table 2 shows the percentage and number of age group populations by gender (BLS-2, 2014) in Wyoming’s workforce during 2012 and 2013. The males had noticeable decreases in employment in two age groups: for the 25-34 age group employment went from 38,000 in 2012 to 36,000 in 2013 and for the 45-54 age group employment went from 36,000 in 2012 to 33,000 in 2013. Within the female age groups, two of them decreased: employment in the 45-54 age group decreased from 29,000 in 2012 to 28,000 in 2013 and in the 55-64 age group employment decreased from 24,000 in 2012 to 23,000 in 2013. R&P research has shown that the number of workplace fatalities is related to changes in overall employment (Manning, 2010). This may also be true for nonfatal occupational injuries and illnesses.
Injury and Illness
Characteristics
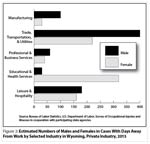 |
For the year 2013, within the trade, transportation, & utilities industry an estimated 400 males and 220 females had cases with days away from work (see Figure 2). During that year, manufacturing had over three times the number of males (100) than females (30) with cases resulting in days away from work. In contrast, more than 10 times the number of females to males had cases with days away from work in the educational & health services industry (320 and 30, respectively). For the leisure & hospitality industry, in 2013 there was almost the same number of males as females (180 and 160, respectively) that had the more severe cases.
 |
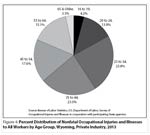 |
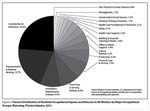
Two of the major occupational groups, construction & extraction and transportation & material moving had a higher-than-average percentage (nearly 43.5% combined) of total workers with work-related injuries or illnesses in 2013 (see Figure 3). More males than females typically work in these occupational groups. Consequently, more males than females were injured in these types of occupations. These workers included construction laborers and heavy & tractor trailer truck drivers. However, more females than males were injured in the major occupational groups of healthcare support and personal care & service because more females than males were usually employed in these occupations. The highest percentage of injuries and illnesses by combined age groups in 2013 was for workers age 25-34 and 35-44 (46.8%; see Figure 4).
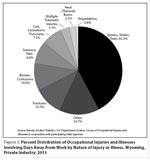 |
For injuries resulting in days away from work, the largest percentage for nature of injury or illness was due to sprains, strains, and tears (42.3% in 2013; see Figure 5). Often the injuries were caused by falling, lifting, twisting and bending, standing or sitting, throwing, or reaching. This suggests that employers should place additional emphasis on sprain and strain prevention.
Summary
From 2012 to 2013, there was not a statistically significant change in the number or incidence rate of Wyoming work-related injuries and illnesses resulting in days away from work for private industry (2,410-3.5 and 2,390-3.4, respectively). Overall, males continued to experience work-related injuries and illnesses more frequently than females. This was likely due, in part, to higher ratios of males to females employed in industries with higher incidence rates; the exception was educational & health services. More details on 2013 data, as well as further documentation and historical data are available at http://doe.state.wy.us/LMI/OSH/toc.htm. For more information, contact Valerie A. Davis at (307) 473-3838 or val.davis@wyo.gov.
References
Bureau of Labor Statistics, Division of Local Area Unemployment Statistics. (2014a). Employment status of the civilian noninstitutional population by sex, age, race, Hispanic or Latino ethnicity, and marital status, 2013 annual averages. Retrieved December 4, 2014, from http://www.bls.gov/opub/gp/pdf/gp13_14.pdf
Bureau of Labor Statistics, Division of Local Area Unemployment Statistics. (2014b). Employment status of the civilian noninstitutional population by sex, race, Hispanic or Latino ethnicity, marital status, and detailed age, 2013 annual averages. Retrieved December 4, 2014, from http://www.bls.gov/lau/table14full13.pdf
Census of Fatal Occupational Injuries and Illnesses, Wyoming. (2014). Retrieved December 4, 2014, from http://doe.state.wy.us/LMI/CFOI/toc.htm
Manning, P. (2010). Employment Change and Impacts on Workplace Fatalities in Wyoming. Wyoming Department of Employment, Research & Planning, Casper: WY. Retrieved December 4, 2014, from http://doe.state.wy.us/LMI/safety/CFOI_Reg_Model_2010.pdf
1Data are not available to determine if the remaining 0.8% of workers who became injured or ill in 2013 were males or females.
Definitions
Case of job transfer: An injured or ill employee was assigned to a job other than his or her regular job for part of the day other than the day of injury or illness.
Case of restricted duty: An employee was kept from performing one or more routine functions (work activities the employee performed at least once per week) of his or her job, or was kept from working a full workday, or a licensed health care professional recommended either of the above.
Cases with days away from work: Severe cases that counted the day after the injury or onset of the illness, which may or may not include days of job transfer or restriction. Up to 180 days away from work (and/or days of job transfer or restriction) are counted for each injury.
Event or exposure: The manner in which the injury or illness was produced or inflicted, such as falls, overexertion, or repetitive motion.
Incidence rate: Represents the number of injuries and illnesses per 100 full-time workers, calculated as (N/EH) x 200,000 where:
- N = number of injuries and illnesses
- EH = total hours worked by all employees during the calendar year
- 200,000 = base for 100 equivalent full-time workers (working 40 hours per week, 50 weeks per year).
Mandatory survey: Participation by private sector employers is required by Public Law 91-596 by the Bureau of Labor Statistics (BLS). Participation by public sector employers is required by law by Wyoming OSHA, as Wyoming is a State Plan State. If an employer receives a survey from the BLS, even if they are partially exempt by OSHA due to having less than 11 employees for example, they must still complete the survey.
Nature of injury or illness: The physical characteristics of the disabling injury or illness, such as cuts, fractures, or sprains.
Other recordable cases: Cases not involving days away from work or days of job transfer or restricted duty but requiring medical treatment beyond first aid. Other recordable cases include, for example, stitches, prescription medication, a concussion, loss of consciousness, medical removal from job site, musculoskeletal disorders, or other significant diagnosed injury or illness.
Out of scope: An employer who did not have employees for the survey year or an employer whose employment size class or industry code changed.
Part of body: The part of the body directly linked to the nature of injury or illness cited, such as back, finger, or eye.
Relative Standard Error (RSE): A percentage of the estimate. The standard error defines a range (confidence interval) around the estimate. The approximate 95 percent confidence interval is the estimate plus or minus twice the standard error. If several different samples were selected to estimate the population value, the 95 percent confidence interval would include the true population value approximately 95 percent of the time.
Source of injury or illness: The object, substance, exposure, or bodily motion that directly caused the disabling condition, such as chemical, vehicle, or machinery.