Economic Indicators
Total nonfarm employment fell by 0.8% from November 2014 to November 2015.
| Nov | Oct | Nov | Percent Change | ||||
|---|---|---|---|---|---|---|---|
| 2015 (p) | 2015 (r) | 2014 (b) | Month | Year | |||
|
(p) Preliminary. (r) Revised. (b) Benchmarked. 1Local Area Unemployment Statistics Program estimates. 2Metropolitan Statistical Area. Note: Production worker hours and earnings data have been dropped from the Economic Indicators page because of problems with accuracy due to a small sample size and high item nonresponse. The Bureau of Labor Statistics will continue to publish these data online at http://www.bls.gov/eag/eag.wy.htm. |
|||||||
| Wyoming Total Nonfarm Employment | 288,600 | 294,200 | 290,800 | -1.9 | -0.8 | ||
| Wyoming State Government | 16,100 | 16,200 | 15,900 | -0.6 | 1.3 | ||
| Laramie County Nonfarm Employment | 47,600 | 47,600 | 47,000 | 0.0 | 1.3 | ||
| Natrona County Nonfarm Employment | 42,300 | 42,800 | 43,200 | -1.2 | -2.1 | ||
| Selected U.S. Employment Data | |||||||
| U.S. Multiple Jobholders | 7,596,000 | 7,620,000 | 7,549,000 | -0.3 | 0.6 | ||
| As a percent of all workers | 5.1% | 5.1% | 5.1% | N/A | N/A | ||
| U.S. Discouraged Workers | 594,000 | 665,000 | 698,000 | -10.7 | -14.9 | ||
| U.S. Part Time for Economic Reasons | 5,967,000 | 5,536,000 | 6,713,000 | 7.8 | -11.1 | ||
| Wyoming Unemployment Insurance | |||||||
| Weeks Compensated | 17,063 | 13,757 | 12,446 | 24.0 | 37.1 | ||
| Benefits Paid | $6,630,242 | $5,508,549 | $4,340,053 | 20.4 | 52.8 | ||
| Average Weekly Benefit Payment | $388.57 | $400.42 | $348.71 | -3.0 | 11.4 | ||
| State Insured Covered Jobs1 | 275,785 | 279,937 | 271,685 | -1.5 | 1.5 | ||
| Insured Unemployment Rate | 2.4% | 1.9% | 1.7% | N/A | N/A | ||
| Consumer Price Index (U) for All U.S. Urban Consumers | |||||||
| (1982 to 1984 = 100) | |||||||
| All Items | 237.3 | 237.8 | 236.2 | -0.2 | 0.5 | ||
| Food & Beverages | 247.9 | 248.6 | 244.9 | -0.3 | 1.2 | ||
| Housing | 239.3 | 239.4 | 234.3 | 0.0 | 2.1 | ||
| Apparel | 127.0 | 129.4 | 129.0 | -1.9 | -1.5 | ||
| Transportation | 194.4 | 195.9 | 206.9 | -0.7 | -6.0 | ||
| Medical Care | 451.4 | 450.1 | 438.4 | 0.3 | 2.9 | ||
| Recreation (Dec. 1997=100) | 115.8 | 116.1 | 115.0 | -0.3 | 0.6 | ||
| Education & Communication (Dec. 1997=100) | 139.5 | 139.3 | 137.7 | 0.1 | 1.3 | ||
| Other Goods & Services | 418.4 | 418.0 | 409.8 | 0.1 | 2.1 | ||
| Producer Prices (1982 to 1984 = 100) | |||||||
| All Commodities | 185.9 | 187.7 | 200.9 | -1.0 | -7.5 | ||
| Wyo. Bldg. Permits (New Privately Owned Housing Units Authorized) | |||||||
| Total Units | 123 | 127 | 107 | -3.1 | 15.0 | ||
| Valuation | $47,114,000 | $37,630,000 | $33,662,000 | 25.2 | 40.0 | ||
| Single Family Homes | 110 | 118 | 101 | -6.8 | 8.9 | ||
| Valuation | $46,249,000 | $36,805,000 | $33,148,000 | 25.7 | 39.5 | ||
| Casper MSA2 Building Permits | 20 | 20 | 14 | 0.0 | 42.9 | ||
| Valuation | $4,906,000 | $3,267,000 | $3,645,000 | 50.2 | 34.6 | ||
| Cheyenne MSA Building Permits | 22 | 24 | 14 | -8.3 | 57.1 | ||
| Valuation | $4,354,000 | $4,789,000 | $2,243,000 | -9.1 | 94.1 | ||
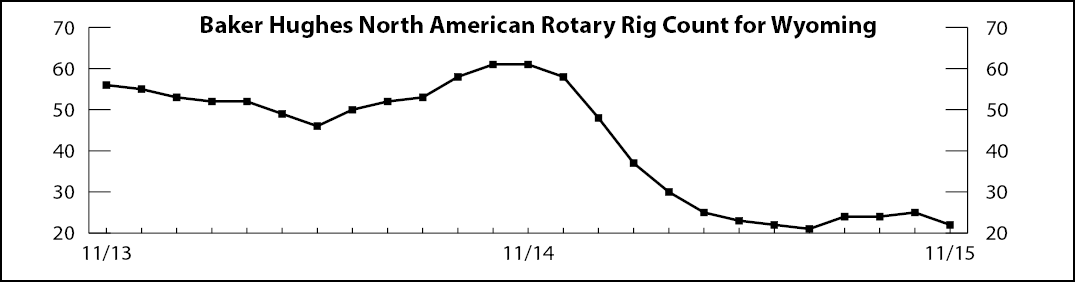
| Baker Hughes North American Rotary Rig Count for Wyoming | 22 | 25 | 61 | -12.0 | -63.9 | ||