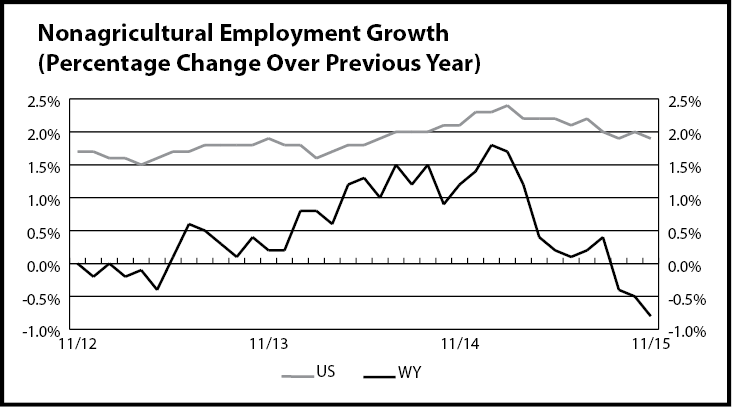
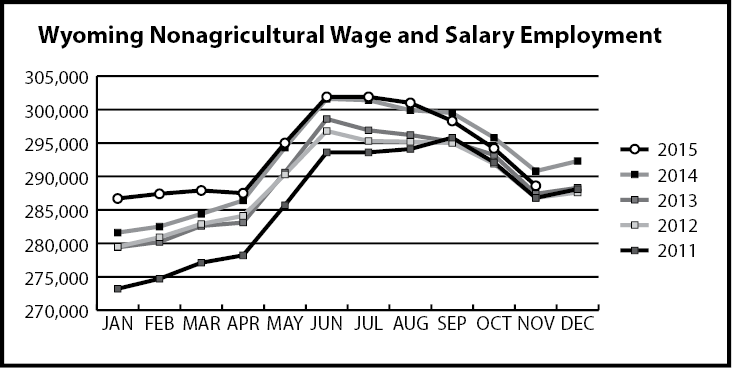
Current Employment Statistics
Current Employment Statistics (CES) Estimates and Research & Planning’s Short-Term Projections, November 2015
| Industry Sector |
Research & Planning’s Short-Term Projections |
Current Employment Statistics (CES) Estimates |
N Difference |
% Difference |
|---|---|---|---|---|
|
Total Nonfarm |
285,348 | 288,600 | 3,252 | 1.1% |
|
Natural Resources & Mining
|
21,553 | 22,600 | 1,047 | 4.6% |
|
Construction |
23,067 | 24,500 | 1,433 | 5.8% |
|
Manufacturing |
10,061 | 10,000 | -61 | -0.6% |
|
Wholesale Trade |
9,386 | 9,000 | -386 | -4.3% |
|
Retail Trade |
30,891 | 30,200 | -691 | -2.3% |
|
Transportation & Utilities
|
15,625 | 15,700 | 75 | 0.5% |
|
Information |
3,759 | 3,700 | -59 | -1.6% |
|
Financial Activities |
10,930 | 11,800 | 870 | 7.4% |
|
Professional & Business Services
|
18,324 | 18,600 | 276 | 1.5% |
|
Educational & Health Services
|
27,468 | 28,100 | 632 | 2.2% |
|
Leisure & Hospitality
|
32,466 | 31,400 | -1,066 | -3.4% |
|
Other Services |
9,709 | 9,800 | 91 | 0.9% |
|
Government |
72,109 | 73,200 | 1,091 | 1.5% |
| Projections were run in October 2015 and based on QCEW data through June 2015. | ||||