March 2011
Wyoming Statewide
--TOTAL ALL OCCUPATIONS
--MANAGEMENT OCCUPATIONS
Administrative Services Managers
Chief Executives
Computer and Information Systems Managers
Construction Managers
Education Administrators, All Other
Education Administrators, Elementary and Secondary School
Education Administrators, Postsecondary
Education Administrators, Preschool and Child Care Center/Program
Emergency Management Directors
Engineering Managers
Financial Managers
Food Service Managers
General and Operations Managers
Human Resources Managers
Industrial Production Managers
Lodging Managers
Managers, All Other
Marketing Managers
Medical and Health Services Managers
Natural Sciences Managers
Postmasters and Mail Superintendents
Property, Real Estate, and Community Association Managers
Public Relations Managers
Purchasing Managers
Sales Managers
Social and Community Service Managers
Training and Development Managers
Transportation, Storage, and Distribution Managers
--BUSINESS AND FINANCIAL OPERATIONS OCCUPATIONS
Accountants and Auditors
Appraisers and Assessors of Real Estate
Budget Analysts
Business Operations Specialists, All Other
Claims Adjusters, Examiners, and Investigators
Compensation, Benefits, and Job Analysis Specialists
Compliance Officers, Except Agriculture, Construction, Health and Safety, and Transport...
Cost Estimators
Credit Analysts
Financial Analysts
Financial Examiners
Financial Specialists, All Other
Human resources, labor relations, and training specialists, all other
Insurance Underwriters
Loan Counselors
Loan Officers
Logisticians
Management Analysts
Market Research Analysts
Meeting and Convention Planners
Personal Financial Advisors
Purchasing Agents, Except Wholesale, Retail, and Farm Products
Tax Examiners, Collectors, and Revenue Agents
Tax Preparers
Training and Development Specialists
Wholesale and Retail Buyers, Except Farm Products
--COMPUTER AND MATHEMATICAL OCCUPATIONS
Computer Occupations, All Other*
Computer Programmers
Computer Software Engineers, Applications
Computer Software Engineers, Systems Software
Computer Support Specialists
Computer Systems Analysts
Database Administrators
Information Security Analysts, Web Developers, and Computer Network Architects
Network and Computer Systems Administrators
Operations Research Analysts
--ARCHITECTURE AND ENGINEERING OCCUPATIONS
Architects, Except Landscape and Naval
Architectural and Civil Drafters
Cartographers and Photogrammetrists
Chemical Engineers
Civil Engineering Technicians
Civil Engineers
Drafters, All Other
Electrical Engineers
Electrical and Electronic Engineering Technicians
Electronics Engineers, Except Computer
Engineering Technicians, Except Drafters, All Other
Engineers, All Other
Environmental Engineering Technicians
Environmental Engineers
Health and Safety Engineers, Except Mining Safety Engineers and Inspectors
Industrial Engineering Technicians
Industrial Engineers
Landscape Architects
Materials Engineers
Mechanical Drafters
Mechanical Engineering Technicians
Mechanical Engineers
Mining and Geological Engineers, Including Mining Safety Engineers
Petroleum Engineers
Surveying and Mapping Technicians
Surveyors
--LIFE, PHYSICAL, AND SOCIAL SCIENCE OCCUPATIONS
Anthropologists and Archeologists
Atmospheric and Space Scientists
Biological Scientists, All Other
Biological Technicians
Chemical Technicians
Chemists
Clinical, Counseling, and School Psychologists
Conservation Scientists
Environmental Science and Protection Technicians, Including Health
Environmental Scientists and Specialists, Including Health
Epidemiologists
Forensic Science Technicians
Forest and Conservation Technicians
Foresters
Geological and Petroleum Technicians
Geoscientists, Except Hydrologists and Geographers
Historians
Hydrologists
Life, Physical, and Social Science Technicians, All Other
Psychologists, All Other
Social Scientists and Related Workers, All Other
Soil and Plant Scientists
Survey Researchers
Urban and Regional Planners
Zoologists and Wildlife Biologists
--COMMUNITY AND SOCIAL SERVICES OCCUPATIONS
Child, Family, and School Social Workers
Clergy
Community and Social Service Specialists, All Other*
Educational, Vocational, and School Counselors
Health Educators
Marriage and Family Therapists
Medical and Public Health Social Workers
Mental Health Counselors
Mental Health and Substance Abuse Social Workers
Probation Officers and Correctional Treatment Specialists
Rehabilitation Counselors
Social Workers, All Other
Social and Human Service Assistants
Substance Abuse and Behavioral Disorder Counselors
--LEGAL OCCUPATIONS
Administrative Law Judges, Adjudicators, and Hearing Officers
Judges, Magistrate Judges, and Magistrates
Judicial Law Clerks
Lawyers
Legal Support Workers, All Other
Paralegals and Legal Assistants
Title Examiners, Abstractors, and Searchers
--EDUCATION, TRAINING, AND LIBRARY OCCUPATIONS
Adult Literacy, Remedial Education, and GED Teachers and Instructors
Agricultural Sciences Teachers, Postsecondary
All Other Teachers, Primary, Secondary, and Adult
Anthropology and Archeology Teachers, Postsecondary
Archivists
Area, Ethnic, and Cultural Studies Teachers, Postsecondary
Art, Drama, and Music Teachers, Postsecondary
Audio-Visual Collections Specialists
Biological Science Teachers, Postsecondary
Business Teachers, Postsecondary
Chemistry Teachers, Postsecondary
Communications Teachers, Postsecondary
Computer Science Teachers, Postsecondary
Criminal Justice and Law Enforcement Teachers, Postsecondary
Curators
Economics Teachers, Postsecondary
Education Teachers, Postsecondary
Education, Training, and Library Workers, All Other
Elementary School Teachers, Except Special Education
Engineering Teachers, Postsecondary
English Language and Literature Teachers, Postsecondary
Farm and Home Management Advisors
Foreign Language and Literature Teachers, Postsecondary
Health Specialties Teachers, Postsecondary
History Teachers, Postsecondary
Instructional Coordinators
Kindergarten Teachers, Except Special Education
Librarians
Library Technicians
Mathematical Science Teachers, Postsecondary
Middle School Teachers, Except Special and Vocational Education
Museum Technicians and Conservators
Nursing Instructors and Teachers, Postsecondary
Philosophy and Religion Teachers, Postsecondary
Physics Teachers, Postsecondary
Political Science Teachers, Postsecondary
Postsecondary Teachers, All Other
Preschool Teachers, Except Special Education
Psychology Teachers, Postsecondary
Recreation and Fitness Studies Teachers, Postsecondary
Secondary School Teachers, Except Special and Vocational Education
Self-Enrichment Education Teachers
Sociology Teachers, Postsecondary
Special Education Teachers, Middle School
Special Education Teachers, Preschool, Kindergarten, and Elementary School
Special Education Teachers, Secondary School
Teacher Assistants
Vocational Education Teachers, Middle School
Vocational Education Teachers, Postsecondary
Vocational Education Teachers, Secondary School
--ARTS, DESIGN, ENTERTAINMENT, SPORTS, AND MEDIA OCCUPATIONS
Audio and Video Equipment Technicians
Broadcast Technicians
Camera Operators, Television, Video, and Motion Picture
Choreographers
Coaches and Scouts
Craft Artists
Editors
Film and Video Editors
Fine Artists, Including Painters, Sculptors, and Illustrators
Floral Designers
Graphic Designers
Interior Designers
Interpreters and Translators
Media and Communication Equipment Workers, All Other
Merchandise Displayers and Window Trimmers
Music Directors and Composers
Photographers
Producers and Directors
Public Address System and Other Announcers
Public Relations Specialists
Radio and Television Announcers
Reporters and Correspondents
Set and Exhibit Designers
Sound Engineering Technicians
Writers and Authors
--HEALTHCARE PRACTITIONERS AND TECHNICAL OCCUPATIONS
Anesthesiologists
Athletic Trainers
Audiologists
Cardiovascular Technologists and Technicians
Chiropractors
Dental Hygienists
Dentists, All Other Specialists
Dentists, General
Diagnostic Medical Sonographers
Dietetic Technicians
Dietitians and Nutritionists
Emergency Medical Technicians and Paramedics
Exercise Physiologists
Family and General Practitioners
Health Diagnosing and Treating Practitioners, All Other
Health Technologists and Technicians, All Other*
Healthcare Practitioners and Technical Workers, All Other*
Internists, General
Licensed Practical and Licensed Vocational Nurses
Medical Records and Health Information Technicians
Medical and Clinical Laboratory Technicians
Medical and Clinical Laboratory Technologists
Nuclear Medicine Technologists
Obstetricians and Gynecologists
Occupational Health and Safety Specialists
Occupational Health and Safety Technicians
Occupational Therapists
Opticians, Dispensing
Optometrists
Pediatricians, General
Pharmacists
Pharmacy Technicians
Physical Therapists
Physician Assistants
Physicians and Surgeons, All Other
Podiatrists
Psychiatric Technicians
Psychiatrists
Radiation Therapists
Radiologic Technologists and Technicians*
Recreational Therapists
Registered Nurses
Respiratory Therapists
Respiratory Therapy Technicians
Speech-Language Pathologists
Surgeons
Surgical Technologists
Veterinarians
Veterinary Technologists and Technicians
--HEALTHCARE SUPPORT OCCUPATIONS
Dental Assistants
Healthcare Support Workers, All Other*
Home Health Aides
Massage Therapists
Medical Assistants
Medical Equipment Preparers
Medical Transcriptionists
Nursing Aides, Orderlies, and Attendants
Occupational Therapist Aides
Occupational Therapist Assistants
Pharmacy Aides
Physical Therapist Aides
Physical Therapist Assistants
Psychiatric Aides
Veterinary Assistants and Laboratory Animal Caretakers
--PROTECTIVE SERVICE OCCUPATIONS
Animal Control Workers
Bailiffs
Correctional Officers and Jailers
Crossing Guards
Detectives and Criminal Investigators
Fire Fighters
Fire Inspectors and Investigators
First-Line Supervisors/Managers of Correctional Officers
First-Line Supervisors/Managers of Fire Fighting and Prevention Workers
First-Line Supervisors/Managers of Police and Detectives
First-Line Supervisors/Managers, Protective Service Workers, All Other
Fish and Game Wardens
Lifeguards, Ski Patrol, and Other Recreational Protective Service Workers
Parking Enforcement Workers
Police and Sheriff's Patrol Officers
Private Detectives and Investigators
Protective Service Workers, All Other
Security Guards
Transportation Security Screeners
--FOOD PREPARATION AND SERVING-RELATED OCCUPATIONS
Bartenders
Chefs and Head Cooks
Combined Food Preparation and Serving Workers, Including Fast Food
Cooks, All Other
Cooks, Fast Food
Cooks, Institution and Cafeteria
Cooks, Restaurant
Cooks, Short Order
Counter Attendants, Cafeteria, Food Concession, and Coffee Shop
Dining Room and Cafeteria Attendants and Bartender Helpers
Dishwashers
First-Line Supervisors/Managers of Food Preparation and Serving Workers
Food Preparation Workers
Food Preparation and Serving Related Workers, All Other
Food Servers, Nonrestaurant
Hosts and Hostesses, Restaurant, Lounge, and Coffee Shop
Waiters and Waitresses
--BUILDING AND GROUNDS CLEANING AND MAINTENANCE OCCUPATIONS
First-Line Supervisors/Managers of Housekeeping and Janitorial Workers
First-Line Supervisors/Managers of Landscaping, Lawn Service, and Groundskeeping Workers
Grounds Maintenance Workers, All Other
Janitors and Cleaners, Except Maids and Housekeeping Cleaners
Landscaping and Groundskeeping Workers
Maids and Housekeeping Cleaners
Pest Control Workers
Pesticide Handlers, Sprayers, and Applicators, Vegetation
Tree Trimmers and Pruners
--PERSONAL CARE AND SERVICE OCCUPATIONS
Amusement and Recreation Attendants
Animal Trainers
Baggage Porters and Bellhops
Child Care Workers
Concierges
Embalmers
First-Line Supervisors/Managers of Personal Service Workers
Fitness Trainers and Aerobics Instructors
Funeral Attendants
Funeral service managers, directors, morticians, and undertakers
Hairdressers, Hairstylists, and Cosmetologists
Manicurists and Pedicurists
Motion Picture Projectionists
Nonfarm Animal Caretakers
Personal Care and Service Workers, All Other
Personal and Home Care Aides
Recreation Workers
Residential Advisors
Tour Guides and Escorts
Ushers, Lobby Attendants, and Ticket Takers
--SALES AND RELATED OCCUPATIONS
Advertising Sales Agents
Cashiers
Counter and Rental Clerks
Demonstrators and Product Promoters
First-Line Supervisors/Managers of Non-Retail Sales Workers
First-Line Supervisors/Managers of Retail Sales Workers
Insurance Sales Agents
Parts Salespersons
Real Estate Brokers
Real Estate Sales Agents
Retail Salespersons
Sales Engineers
Sales Representatives, Services, All Other
Sales Representatives, Wholesale and Manufacturing, Except Technical and Scientific Pro...
Sales Representatives, Wholesale and Manufacturing, Technical and Scientific Products
Sales and Related Workers, All Other*
Securities, Commodities, and Financial Services Sales Agents
Telemarketers
Travel Agents
--OFFICE AND ADMINISTRATIVE SUPPORT OCCUPATIONS
Bill and Account Collectors
Billing and Posting Clerks and Machine Operators
Bookkeeping, Accounting, and Auditing Clerks
Cargo and Freight Agents
Computer Operators
Couriers and Messengers
Court, Municipal, and License Clerks
Customer Service Representatives
Data Entry Keyers
Dispatchers, Except Police, Fire, and Ambulance
Eligibility Interviewers, Government Programs
Executive Secretaries and Administrative Assistants
File Clerks
First-Line Supervisors/Managers of Office and Administrative Support Workers
Hotel, Motel, and Resort Desk Clerks
Human Resources Assistants, Except Payroll and Timekeeping
Information and Record Clerks, All Other
Insurance Claims and Policy Processing Clerks
Interviewers, Except Eligibility and Loan
Legal Secretaries
Library Assistants, Clerical
Loan Interviewers and Clerks
Mail Clerks and Mail Machine Operators, Except Postal Service
Medical Secretaries
Meter Readers, Utilities
New Accounts Clerks
Office Clerks, General
Office Machine Operators, Except Computer
Office and Administrative Support Workers, All Other*
Order Clerks
Payroll and Timekeeping Clerks
Police, Fire, and Ambulance Dispatchers
Postal Service Clerks
Postal Service Mail Carriers
Postal Service Mail Sorters, Processors, and Processing Machine Operators
Procurement Clerks
Production, Planning, and Expediting Clerks
Receptionists and Information Clerks
Reservation and Transportation Ticket Agents and Travel Clerks
Secretaries, Except Legal, Medical, and Executive
Shipping, Receiving, and Traffic Clerks
Stock Clerks and Order Fillers
Switchboard Operators, Including Answering Service
Tellers
Weighers, Measurers, Checkers, and Samplers, Recordkeeping
--FARMING, FISHING, AND FORESTRY OCCUPATIONS
Agricultural Equipment Operators
Agricultural Workers, All Other
Fallers
Farmworkers and Laborers, Crop, Nursery, and Greenhouse
Farmworkers, Farm and Ranch Animals
First-Line Supervisors/Managers of Farming, Fishing, and Forestry Workers
Logging Equipment Operators
--CONSTRUCTION AND EXTRACTION OCCUPATIONS
Brickmasons and Blockmasons
Carpenters
Carpet Installers
Cement Masons and Concrete Finishers
Construction Laborers
Construction and Building Inspectors
Construction and Related Workers, All Other*
Continuous Mining Machine Operators
Derrick Operators, Oil and Gas
Drywall and Ceiling Tile Installers
Earth Drillers, Except Oil and Gas
Electricians
Explosives Workers, Ordnance Handling Experts, and Blasters
Extraction Workers, All Other
Fence Erectors
First-Line Supervisors/Managers of Construction Trades and Extraction Workers
Glaziers
Hazardous Materials Removal Workers
Helpers--Brickmasons, Blockmasons, Stonemasons, and Tile and Marble Setters
Helpers--Carpenters
Helpers--Electricians
Helpers--Extraction Workers
Helpers--Painters, Paperhangers, Plasterers, and Stucco Masons
Helpers--Pipelayers, Plumbers, Pipefitters, and Steamfitters
Highway Maintenance Workers
Insulation Workers, Floor, Ceiling, and Wall
Insulation Workers, Mechanical
Mine Cutting and Channeling Machine Operators
Operating Engineers and Other Construction Equipment Operators
Painters, Construction and Maintenance
Paving, Surfacing, and Tamping Equipment Operators
Pile-Driver Operators
Pipelayers
Plasterers and Stucco Masons
Plumbers, Pipefitters, and Steamfitters
Rail-Track Laying and Maintenance Equipment Operators
Reinforcing Iron and Rebar Workers
Roof Bolters, Mining
Roofers
Rotary Drill Operators, Oil and Gas
Roustabouts, Oil and Gas
Septic Tank Servicers and Sewer Pipe Cleaners
Service Unit Operators, Oil, Gas, and Mining
Sheet Metal Workers
Stonemasons
Structural Iron and Steel Workers
Tile and Marble Setters
--INSTALLATION, MAINTENANCE, AND REPAIR OCCUPATIONS
Aircraft Mechanics and Service Technicians
Automotive Body and Related Repairers
Automotive Glass Installers and Repairers
Automotive Service Technicians and Mechanics
Avionics Technicians
Bicycle Repairers
Bus and Truck Mechanics and Diesel Engine Specialists
Coin, Vending, and Amusement Machine Servicers and Repairers
Computer, Automated Teller, and Office Machine Repairers
Control and Valve Installers and Repairers, Except Mechanical Door
Electric Motor, Power Tool, and Related Repairers
Electrical Power-Line Installers and Repairers
Electrical and Electronics Repairers, Commercial and Industrial Equipment
Electrical and Electronics Repairers, Powerhouse, Substation, and Relay
Electronic Equipment Installers and Repairers, Motor Vehicles
Electronic Home Entertainment Equipment Installers and Repairers
Farm Equipment Mechanics
First-Line Supervisors/Managers of Mechanics, Installers, and Repairers
Heating, Air Conditioning, and Refrigeration Mechanics and Installers
Helpers--Installation, Maintenance, and Repair Workers
Home Appliance Repairers
Industrial Machinery Mechanics
Installation, Maintenance, and Repair Workers, All Other*
Locksmiths and Safe Repairers
Maintenance Workers, Machinery
Maintenance and Repair Workers, General
Medical Equipment Repairers
Millwrights
Mobile Heavy Equipment Mechanics, Except Engines
Motorcycle Mechanics
Outdoor Power Equipment and Other Small Engine Mechanics
Precision Instrument and Equipment Repairers, All Other
Radio Mechanics
Rail Car Repairers
Recreational Vehicle Service Technicians
Riggers
Security and Fire Alarm Systems Installers
Telecommunications Equipment Installers and Repairers, Except Line Installers
Telecommunications Line Installers and Repairers
Tire Repairers and Changers
--PRODUCTION OCCUPATIONS
Assemblers and Fabricators, All Other
Bakers
Butchers and Meat Cutters
Cabinetmakers and Bench Carpenters
Chemical Equipment Operators and Tenders
Chemical Plant and System Operators
Cleaning, Washing, and Metal Pickling Equipment Operators and Tenders
Coating, Painting, and Spraying Machine Setters, Operators, and Tenders
Computer-Controlled Machine Tool Operators, Metal and Plastic
Crushing, Grinding, and Polishing Machine Setters, Operators, and Tenders
Cutting and Slicing Machine Setters, Operators, and Tenders
Cutting, Punching, and Press Machine Setters, Operators, and Tenders, Metal and Plastic
Dental Laboratory Technicians
Electrical and Electronic Equipment Assemblers
Etchers and Engravers
Extruding, Forming, Pressing, and Compacting Machine Setters, Operators, and Tenders
Fiberglass Laminators and Fabricators
First-Line Supervisors/Managers of Production and Operating Workers
Food Batchmakers
Food Cooking Machine Operators and Tenders
Food and Tobacco Roasting, Baking, and Drying Machine Operators and Tenders
Furnace, Kiln, Oven, Drier, and Kettle Operators and Tenders
Gas Plant Operators
Grinding and Polishing Workers, Hand
Helpers--Production Workers
Inspectors, Testers, Sorters, Samplers, and Weighers
Jewelers and Precious Stone and Metal Workers
Laundry and Dry-Cleaning Workers
Machinists
Meat, Poultry, and Fish Cutters and Trimmers
Mixing and Blending Machine Setters, Operators, and Tenders
Molders, Shapers, and Casters, Except Metal and Plastic
Molding, Coremaking, and Casting Machine Setters, Operators, and Tenders, Metal and Pla...
Packaging and Filling Machine Operators and Tenders
Painters, Transportation Equipment
Painting, Coating, and Decorating Workers
Petroleum Pump System Operators, Refinery Operators, and Gaugers
Photographic Process Workers and Priocessing Machine Operators
Plant and System Operators, All Other
Power Distributors and Dispatchers
Power Plant Operators
Prepress Technicians and Workers
Pressers, Textile, Garment, and Related Materials
Print Binding and Finishing Workers
Printing Press Operators
Production Workers, All Other*
Sawing Machine Setters, Operators, and Tenders, Wood
Separating, Filtering, Clarifying, Precipitating, and Still Machine Setters, Operators,...
Sewing Machine Operators
Shoe and Leather Workers and Repairers
Slaughterers and Meat Packers
Stationary Engineers and Boiler Operators
Structural Metal Fabricators and Fitters
Tailors, Dressmakers, and Custom Sewers
Team Assemblers
Textile, Apparel, and Furnishings Workers, All Other
Tool and Die Makers
Water and Liquid Waste Treatment Plant and System Operators
Welders, Cutters, Solderers, and Brazers
Welding, Soldering, and Brazing Machine Setters, Operators, and Tenders
Woodworkers, All Other
Woodworking Machine Setters, Operators, and Tenders, Except Sawing
--TRANSPORTATION AND MATERIAL MOVING OCCUPATIONS
Air Traffic Controllers
Airline Pilots, Copilots, and Flight Engineers
Ambulance Drivers and Attendants, Except Emergency Medical Technicians
Bus Drivers, School
Bus Drivers, Transit and Intercity
Cleaners of Vehicles and Equipment
Commercial Pilots
Conveyor Operators and Tenders
Crane and Tower Operators
Driver/Sales Workers
Excavating and Loading Machine and Dragline Operators
First-Line Supervisors/Managers of Helpers, Laborers, and Material Movers, Hand
First-Line Supervisors/Managers of Transportation and Material-Moving Machine and Vehic...
Gas Compressor and Gas Pumping Station Operators
Industrial Truck and Tractor Operators
Laborers and Freight, Stock, and Material Movers, Hand
Loading Machine Operators, Underground Mining
Machine Feeders and Offbearers
Motor Vehicle Operators, All Other
Packers and Packagers, Hand
Parking Lot Attendants
Pump Operators, Except Wellhead Pumpers
Railroad Brake, Signal, and Switch Operators
Railroad Conductors and Yardmasters
Refuse and Recyclable Material Collectors
Service Station Attendants
Shuttle Car Operators
Taxi Drivers and Chauffeurs
Traffic Technicians
Transportation Workers, All Other
Truck Drivers, Heavy and Tractor-Trailer
Truck Drivers, Light or Delivery Services
Wellhead Pumpers
Wyoming Statewide
All-industry
Estimated employment
520
Mean wage
64,504
10th percentile wage
21,658
25th percentile wage
28,041
50th percentile wage
52,408
75th percentile wage
94,611
90th percentile wage
136,351
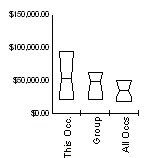
Postsecondary Teachers, All Other (25-1199)
All postsecondary teachers not listed separately.
Median Wage History
This Occupation
Compared to Occupational Group
Difference
Current
$52,408
+0.6%
$48,039
+0.6%
$4,369
2010
$52,088
+1.7%
$47,746
+1.7%
$4,342
2009
$51,175
+1.0%
$46,909
+1.0%
$4,266
2008
$50,628
+3.0%
$46,407
+3.0%
$4,221
2007
$49,121
+3.4%
$45,026
+3.4%
$4,095
2006
$47,478
+4.0%
$43,520
+4.0%
$3,958
2005
$45,652
+2.8%
$41,846
+2.8%
$3,806
2004
$44,373
+3.1%
$40,674
+3.1%
$3,699
2003
$43,004
+3.0%
$39,419
+3.0%
$3,585
2002
$41,726
+2.3%
$38,247
+2.3%
$3,479
2001
$40,767
$37,368
$3,399
This Occupation
Compared to All Occupations
Difference
Current
$52,408
+0.6%
$35,560
+0.3%
$16,848
2010
$52,088
+1.7%
$35,434
+1.7%
$16,654
2009
$51,175
+1.0%
$34,837
+1.3%
$16,338
2008
$50,628
+3.0%
$34,366
+2.6%
$16,262
2007
$49,121
+3.4%
$33,487
+3.2%
$15,634
2006
$47,478
+4.0%
$32,419
+3.2%
$15,059
2005
$45,652
+2.8%
$31,413
+2.4%
$14,239
2004
$44,373
+3.1%
$30,660
+2.6%
$13,713
2003
$43,004
+3.0%
$29,874
+3.1%
$13,130
2002
$41,726
+2.3%
$28,963
+2.5%
$12,763
2001
$40,767
$28,241
$12,526