
|
|
|
|
|
|
|
|
|
|
|
|
|
|
|
|
|
|
|
|
|
|
|
|
|
|
|
|
|
|
|
|
| |
|
|
|
|
Employment Second Quarter |
|
Employment First Quarter |
|
|
|
|
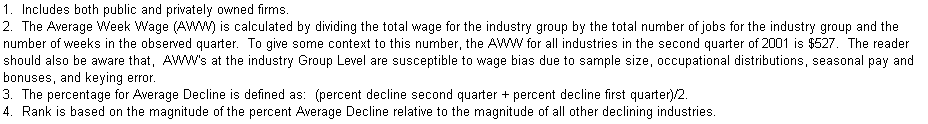
| SECTOR |
SUBSECTOR |
NAICS1 |
2001Q2 AWW2 |
|
|
|
|
|
|
|
|
|
|
|
Avg. Decline3 |
|
| |
|
|
|
|
2001Q2 |
2000Q2 |
Decline |
|
2001Q1 |
2000Q1 |
Decline |
|
|
|
|
| |
|
|
|
|
N |
N |
N |
% |
|
N |
N |
N |
% |
|
% |
RANK4 |
|
| Agriculture,
Forestry, Fishing and Hunting |
Forestry and logging |
113 |
$400.96 |
|
153 |
183 |
-30 |
-16.4% |
|
171 |
201 |
-30 |
-14.9% |
|
-15.7% |
3 |
|
| Manufacturing |
Wood product manufacturing |
321 |
$495.42 |
|
847 |
934 |
-87 |
-9.3% |
|
865 |
976 |
-111 |
-11.4% |
|
-10.3% |
6 |
|
| Manufacturing |
Nonmetallic mineral product
manufacturing |
327 |
$687.83 |
|
849 |
915 |
-66 |
-7.2% |
|
781 |
825 |
-44 |
-5.3% |
|
-6.3% |
10 |
|
| Manufacturing |
Computer and electronic product
manufacturing |
334 |
$673.58 |
|
276 |
296 |
-20 |
-6.8% |
|
278 |
309 |
-31 |
-10.0% |
|
-8.4% |
9 |
|
| Manufacturing |
Transportation equipment
manufacturing |
336 |
$473.70 |
|
355 |
402 |
-47 |
-11.7% |
|
365 |
424 |
-59 |
-13.9% |
|
-12.8% |
4 |
|
| Transportation
and Warehousing |
Pipeline transportation |
486 |
$1,119.35 |
|
545 |
686 |
-141 |
-20.6% |
|
600 |
683 |
-83 |
-12.2% |
|
-16.4% |
2 |
|
| Information |
Broadcasting, except Internet |
515 |
$430.11 |
|
545 |
600 |
-55 |
-9.2% |
|
555 |
607 |
-52 |
-8.6% |
|
-8.9% |
8 |
|
| Management
of Companies and Enterprises |
Management of companies and
enterprises |
551 |
$743.49 |
|
781 |
1,224 |
-443 |
-36.2% |
|
822 |
1,243 |
-421 |
-33.9% |
|
-35.0% |
1 |
|
| Other
Services, Except Public Administration |
Personal and laundry services |
812 |
$291.92 |
|
2,173 |
2,351 |
-178 |
-7.6% |
|
2,003 |
2,247 |
-244 |
-10.9% |
|
-9.2% |
7 |
|
| Public
Administration |
Administration of economic
programs |
926 |
$603.01 |
|
3,485 |
3,964 |
-479 |
-12.1% |
|
3,182 |
3,491 |
-309 |
-8.9% |
|
-10.5% |
5 |
|
| Total |
|
N/A |
$557.49 |
|
10,009 |
11,555 |
-1546 |
-13.4% |
|
9,622 |
11,006 |
-1384 |
-12.6% |
|
-13.0% |
N/A |
|
|
|
|
|
|
|
|
|
|
|
|
|
|
|
|
|
|
|
|
|
|
|
|
|
|
| Table of
Contents |
Labor Market
Information |
|
|
|
|
|
|
|
|
|
|
|
|
|
|
|
|
|
|
|
|
|
|
|