Wages in the Nonprofit Sector: Management, Professional, and Administrative Support Occupations
The National Compensation Survey now publishes wage data on full-time workers in private nonprofit establishments. This article compares the average hourly earnings of full-time workers in private nonprofits, private industry as a whole, state government, and local government.
In 2007 there were more than 1.64 million nonprofit organizations in the United States.1 The nonprofit sector has expanded in terms of number of organizations and number of paid employees. In 1994 there were more than 1.1 million nonprofit organizations in the United States,2 employing approximately 5.4 million people, or 4.4% of all workers. By 2007 nonprofits employed 8.7 million workers, or 5.9% of all workers.3 Health professionals, educators, other professionals, health technicians, administrative support workers, and service occupations account for the majority of paid workers in the nonprofit sector.4
Considering the growth of the nonprofit sector, it is interesting to compare the wage rates of workers in nonprofits with those of their counterparts in private industry as a whole5 and in state and local government. The National Compensation Survey (NCS) provides a source of recent data for making this comparison. Separate wage estimates for full-time workers in private nonprofit establishments were published in the annual wage publication National Compensation Survey: Occupational Earnings in the United States, 2007.6 The NCS now provides average hourly wage estimates for full-time workers employed in all private industry, the private nonprofit sector, state government, and local government by occupational group and by detailed occupation.7
There are several hypotheses as to why the wages of nonprofit workers could differ from their for-profit counterparts. According to the labor donation hypothesis, workers in the nonprofit sector are willing to donate a portion of their paid labor and receive lower wages because they obtain satisfaction from the fact that their efforts achieve altruistic goals. Also, nonprofits may pay lower wages and compensate their workers with employer-provided benefits or other favorable job characteristics such as a flexible work schedule. On the other hand, nonprofits might actually pay higher wages because nonprofits do not benefit from the cost reductions of paying lower wages in the same way that for-profit employers do. In addition, nonprofits may choose to hire better quality workers in order to produce a better quality product or service and pay these employees higher wages.8
The term nonprofit refers to organizations that are neither for-profit businesses nor government agencies. Nonprofits are a subset of private industry. Nonprofit organizations may generate revenue, but this revenue cannot be distributed to owners or employees as they might be in a for-profit business. Nonprofits include, but are not limited to, hospitals, churches, educational institutions, social welfare organizations, and charitable organizations.
FindingsThis article compares the wages of management, selected professional, and administrative support workers in nonprofit organizations with those of their counterparts9 in private industry as a whole, state government, and local government. Management, selected professional, and administrative support occupations are found in many industries, working in support of an organization's main function.10
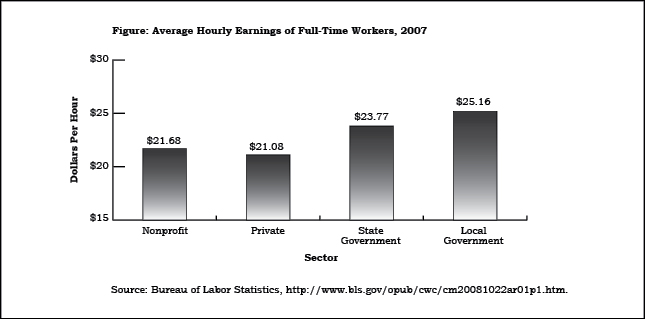
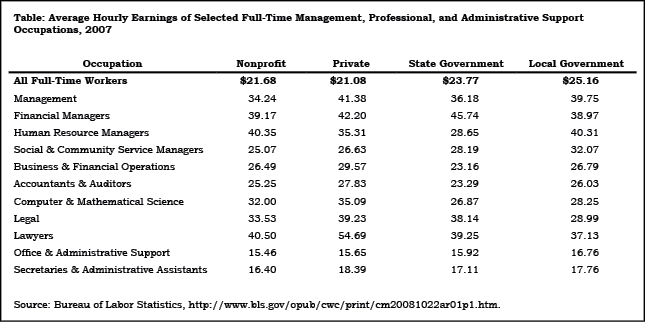
As can be seen in the Figure, the average hourly earnings of full-time workers in nonprofits were $21.68 in 2007. This was somewhat greater than the average hourly wages of all full-time private industry workers ($21.08). However, nonprofit workers earned less than state government workers ($23.77 per hour) and local government workers ($25.16 per hour). It should be noted that such wage differences might be due in part to differences in occupational composition among the sectors. See the Table for wage estimates for selected full-time management, professional, and administrative support occupations in 2007.
SummaryManagers in nonprofit organizations earned wages that were not significantly different from those in state government; however, their wages were lower on average than managers in all private industry and in local government.
Workers in business & financial operations occupations earned more per hour in nonprofits than in state government. However, wages of these workers in nonprofits did not differ significantly from those in local government. Wages of business & financial workers were the greatest in private industry as a whole.
Computer & mathematical science workers in nonprofit establishments had higher wages than their counterparts in state and local government, but their wages were lower than in all private industry.
Nonprofit workers in office & administrative support occupations had very similar wages to their counterparts in state government and in all private industry, but their wages were lower than those of local government workers.
1Internal Revenue Service Data Book 2007, Publication 55B (Internal Revenue Service, March 2008), table 25, http://www.irs.gov/taxstats/article/0,,id=168593,00.html
2Internal Revenue Service Data Book 1997, Publication 55B (Internal Revenue Service), table 27, http://www.irs.gov/taxstats/article/0,,id=97216,00.html
3Unpublished data from the Current Population Survey (CPS), 1994 and 2007 annual averages of the total number of full-time nonagricultural private wage and salary workers employed at nonprofit organizations. Note that 1994 was the first year the CPS collected private nonprofit employment data.
4Christopher J. Ruhm and Carey Borkoski, "Compensation in the Nonprofit Sector," The Journal of Human Resources, autumn 2003, pp. 992-1021.
5Private industry includes both nonprofit and for-profit establishments. Wage estimates for employees of for-profit establishments are not available.
6National Compensation Survey: Occupational Earnings in the United States, 2007, Bulletin 2704 (Bureau of Labor Statistics, August 2008), http://www.bls.gov/ncs/ncswage2007.htm
7For more information on detailed occupations, see National Compensation Survey: Occupational Earnings in the United States, 2007, appendix B, http://www.bls.gov/ncs/ocs/sp/ncbl0841.pdf
8Christopher J. Ruhm and Carey Borkoski, "Compensation in the Nonprofit Sector," The Journal of Human Resources, autumn 2003, pp. 992-1021; Laura Leete, "Whither the Nonprofit Wage Differential? Estimates from the 1990 Census," Journal of Labor Economics, January 2001, pp. 136-170.
9That is, those workers who are classified in the same occupations according to the 2000 Standard Occupational Classification system.
10Data on employment by industry and occupation are available from the BLS Occupational Employment Statistics program, http://www.bls.gov/oes
Return to text
Return to text
Last modified on
by April Szuch.