Turnover and Labor Market Context for Wyoming State Employees
This article examines employment and turnover statistics for Wyoming’s Department of Family Services, Department of Employment, and Department of Workforce Services. In the future, turnover and source/destination data could be used to learn how policy changes may alter the workplace and how market forces beyond the control of the agencies may influence hire and exit rates.
This article uses administrative data available to Research & Planning (R&P) to capture employment and turnover statistics and defines the labor market in which the Department of Family Services (DFS), Department of Employment (DOE), and Department of Workforce Services (DWS) function. The data describe what has happened in the recent past. In the future, turnover and source/destination data could be used to ascertain the overall effect of policy changes intended to alter the workplace (e.g., “What happened to the exit rate in our agency after we did X?”) or to understand how market forces beyond the control of the agency may influence hire and exit rates (e.g., “How is competition from the energy boom affecting our ability to retain employees?”).
Data SourcesData used for this research included Unemployment Insurance (UI) wage records for Wyoming and partner research states (discussed below) and the Wyoming Quarterly Census of Employment and Wages (QCEW). UI wage records described a person’s work history and employers, while QCEW data identified the employer’s industry and ownership.
MethodologyThe method for tracking state employees was developed previously (Harris, 2006). The source and destination was limited to the four quarters before and after the quarter in which a state employee was hired or exited, and was defined as the employer paying the highest wages. If state employees were not employed before being hired or after exiting, they were categorized as not working.
Category DefinitionsThe category of partner research state, for purposes of this analysis, includes Alaska, Colorado, Idaho, Montana, Nebraska, New Mexico, South Dakota, and Utah. All states bordering Wyoming are included. No report was made on the industry or ownership status of the out-of-state firms in question.
Wyoming resident status (resident and nonresident) was determined by methodology developed by Jones (2004). Resident status applied during the quarter in which a state employee was hired or exited. Retirement refers to Wyoming residents who were older than age 62. Government includes establishments that were publicly owned. The category of private sector represents privately owned Wyoming establishments.
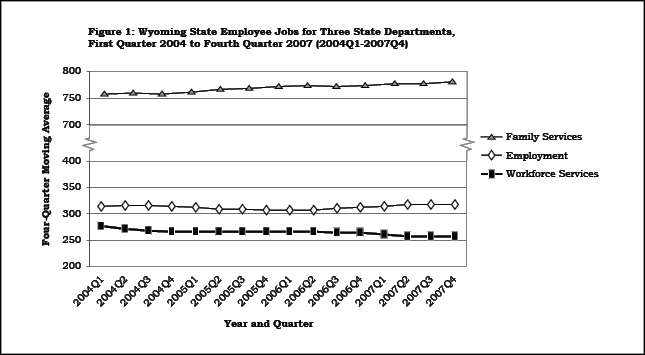
Number of Jobs WorkedFigure 1 presents job counts for the three state agencies studied from first quarter 2004 to fourth quarter 2007. A four-quarter moving average was used to reduce seasonal variation and to provide a better picture of the overall trend in job growth or decline. DOE typically maintained between 310 and 320 jobs on an average quarterly basis throughout the 16 quarters. DFS experienced steady growth in the number of jobs worked throughout the 16-quarter time frame. The agency grew from just slightly fewer than 760 jobs to slightly more than 780 jobs on an average quarterly basis. On the other hand, DWS had a decline in the number of jobs worked on an average quarterly basis, from nearly 280 jobs to approximately 255 jobs by the end of the time frame.
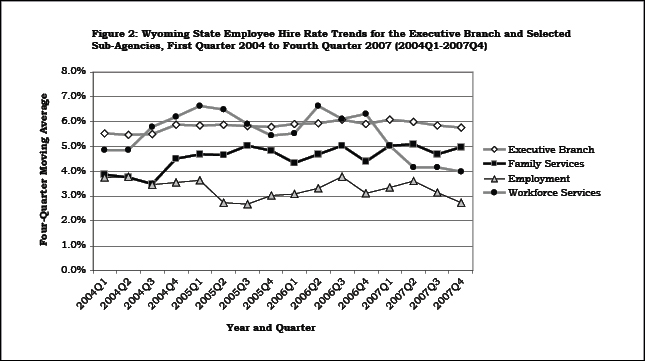
Hire RateThe hire rate was calculated as the number of hires (see Glover, 2001, for definition of hires and exits) in the reference quarter divided by the total number of jobs in the same quarter and expressed as a percentage. Figure 2 shows the four-quarter moving average hire rate for first quarter 2004 to fourth quarter 2007. To provide a comparison to the performance of all executive branch state agencies, the hire rate for the executive branch is included. The hire rate for all executive branch agencies was approximately 6.0% on an average quarterly basis and was very stable for the entire time frame. DOE had the lowest hire rate of the three agencies at approximately 3.0%. This was substantially lower than the rate for all executive branch agencies combined. The hire rate for DWS vacillated near 6.0% until fourth quarter 2006, when it dropped dramatically to approximately 4.0% and remained there through the end of the time frame. The hire rate for DFS trended upward throughout this time, increasing from approximately 4.0% to approximately 5.0%.
Source of Employee HiresThe source of employee hires was defined as the most recent employer (looking at previous employment up to a maximum of one year prior to the reference quarter) that paid the most wages. When there was no employment history in the previous year, other information was used to categorize the hire. For example, those without a work history in the prior year were divided into residents and nonresidents at the time of hire (see Jones, 2004, for resident/nonresident methodology).
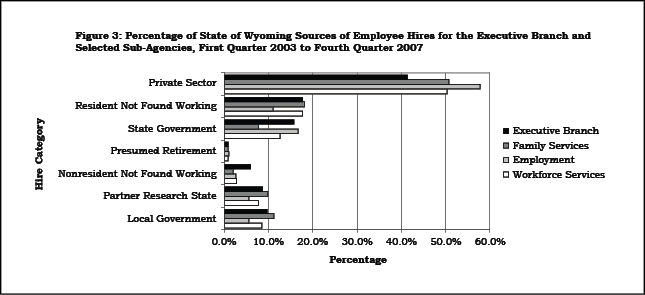
Figure 3 shows hire source information for first quarter 2003 to fourth quarter 2007. Not all findings shown in Figure 3 will be discussed in this section. The major findings indicate that the source of hires for executive branch agencies was primarily dominated (more than 50.0% for each of the three agencies under study) by private sector employers in Wyoming. This held true for all three agencies. A specific example of this would be someone hired into DOE who worked previously in retail trade in Wyoming. It should be noted that there were substantial variations in the source of employee hires for the three agencies. For instance, DOE had a larger percentage of hires who came from other state government agencies than did DFS or DWS. Very few hires were individuals who were presumed to be retired (i.e., no previous work history in the last year and older than age 62).
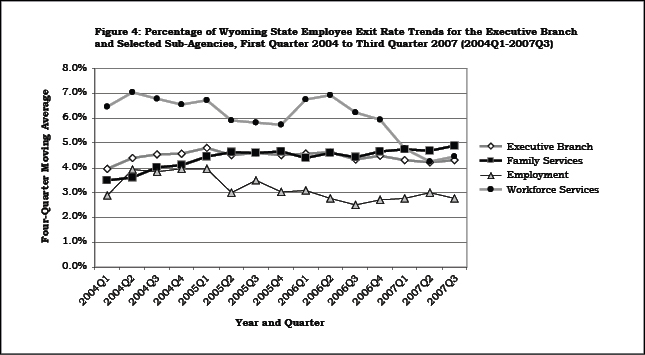
Exit RateThe exit rate was calculated as the number of exits in the reference quarter divided by the total number of jobs in the same quarter and expressed as a percentage. Figure 4 shows the four-quarter moving average exit rate for first quarter 2004 through third quarter 2007. The exit rate for the executive branch remained steady at approximately 4.5% on an average quarterly basis. The rate for DFS was similar but trended above the executive branch rate after third quarter 2006. The exit rate for DWS was dramatically higher (typically higher than 6.0%) until second quarter 2006. After second quarter 2006 the rate dropped each quarter until leveling off near 4.5% during second quarter 2007. The exit rate for DOE was consistently below the rate for the executive branch throughout the time frame. The rate was at or below 3.0% after first quarter 2006.
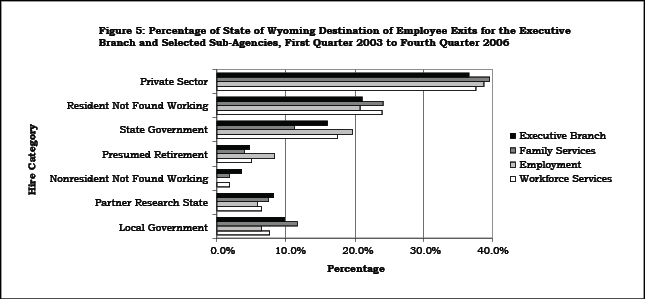
Destination of Employee ExitsThe destination of employee exits is defined as the most recent employer (looking at subsequent employment up to a maximum of one year after the reference quarter) that paid the most wages. When there was no employment history in the subsequent year, other information was used to categorize the hire. Approximately 40.0% of employees obtained primary employment in the private sector after exiting from the three state agencies under study (see Figure 5). Approximately 20.0% of exiters from DOE and DWS obtained employment in another state agency. Approximately 10.0% of DFS exiting employees obtained work in another state government agency – the lowest of the three agencies. DFS exiters were somewhat more likely to find subsequent work in a partner research state or in local government (e.g., a city or county).
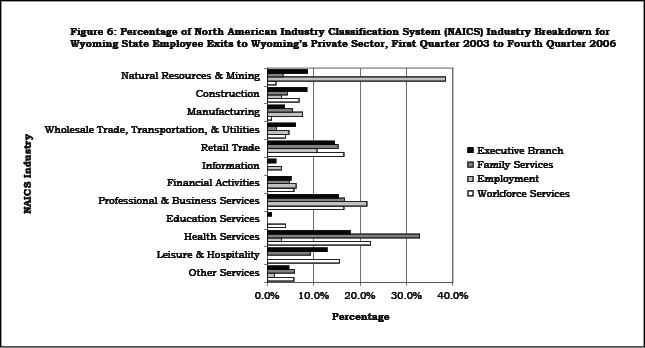
Private Sector BreakdownFigure 6 is an extension of Figure 5. It provides more specific detail on exiters who subsequently obtained work in the private sector. This graphic provides greater detail on the private sector North American Industry Classification System (NAICS) industries that compete for labor with the three state agencies. There was substantial variation in the industry breakdown of state employee exiters. Most notably were natural resources & mining and health services. Approximately 40.0% of DOE exiters who went into the private sector ended up working in natural resources & mining. DWS and DFS had fewer than 5.0% of exiters in this NAICS category. DFS had more than 30.0% of exiters subsequently working in health services. DOE had fewer than 5.0% of exiters working in this category. Of the three agencies, DWS had the greatest percentage of exiters working in retail trade and leisure & hospitality.
ObservationsDOE remained about the same in terms of the number of jobs and had a declining hire rate and a declining exit rate for the period under study. DOE appears to be a very stable agency in terms of both size and turnover activity. Hire and exit rates were both well below those for the entire executive branch.
DWS appeared to trend downward in size – losing approximately 25 jobs worked on an average quarterly basis during the study period. DWS experienced very high hire and exit rates (in comparison to all executive branch agencies) earlier in the time frame but had a dramatic drop in turnover activity after fourth quarter 2006. By the end of the time frame, exit rates were approximately the same level as all executive branch agencies (slightly higher than 4.0% on an average quarterly basis). DWS appeared to become a smaller and more stable agency.
DFS grew in the number of jobs worked over the course of the study period. It also had increasing hire and exit rates throughout the study period. With exit rates exceeding those for the entire executive branch after third quarter 2006, DFS grew but had less employment stability over time.
All three state agencies appeared to be strongly tied to Wyoming’s labor market, hiring from and losing exiters to private sector employers in the state. Other agencies within state government and local government entities also formed a substantial portion of the market for hires and exits among the three agencies. Fewer than 10.0% of hires or exits involved a partner research state.
ReferencesGlover, W. (2001). Turnover analysis: Definitions, process, and quantifications. Retrieved July 18, 2008, from http://doe.state.wy.us/LMI/w_r_research/Turnover_Methodology.pdf
Harris, M. A. (2006). Where do they come from and where do they go: Wyoming employers compete for older workers. Wyoming Labor Force Trends, 43(12). Retrieved July 18, 2008, from http://doe.state.wy.us/LMI/1206/a1.htm
Jones, S. D. (2004). Worker residency determination – Wyoming stepwise procedure. Retrieved July 18, 2008, from http://doe.state.wy.us/LMI/0804/a1supp.htm
Return to text
Return to text
Return to text
Return to text
Return to text
Return to text
Last modified on
by April Szuch.