|
|
|
|
Percent Change
Claims Filed |
Difference |
|
Claims Filed |
Jul_06 |
Jul_06 |
Jul_06 |
|
Jul_06 |
Jun_06 |
Jul_05 |
Jun_06 |
Jul_05 |
Jul_05 |
| Wyoming Statewide |
|
|
|
|
|
|
|
|
|
|
|
|
|
| Total Claims Filed |
1,103 |
992 |
1,058 |
11.2 |
4.3 |
45 |
|
|
|
|
|
|
|
| Goods-Producing |
388 |
328 |
312 |
18.3 |
24.4 |
76 |
|
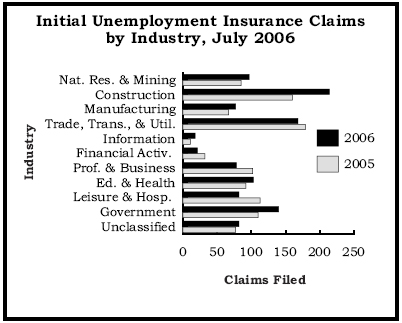
Natural Resources and Mining (11,21) |
97 |
74 |
85 |
31.1 |
14.1 |
12 |
|
Mining (21) |
91 |
55 |
79 |
65.5 |
15.2 |
12 |
|
Oil & Gas Extraction (211) |
5 |
5 |
4 |
0.0 |
25.0 |
1 |
|
Construction (23) |
214 |
224 |
160 |
-4.5 |
33.8 |
54 |
|
Manufacturing (31 - 33) |
77 |
30 |
67 |
156.7 |
14.9 |
10 |
| Service-Providing |
493 |
490 |
559 |
0.6 |
-11.8 |
-66 |
|
Trade, Transportation, and Utilities (22,42,44-45,48-49) |
168 |
131 |
179 |
28.2 |
-6.1 |
-11 |
|
Wholesale Trade (42) |
38 |
22 |
19 |
72.7 |
100.0 |
19 |
|
Retail Trade (44 - 45) |
89 |
76 |
118 |
17.1 |
-24.6 |
-29 |
|
Transportation, Warehousing and Utilities (22,48 - 49) |
41 |
33 |
42 |
24.2 |
-2.4 |
-1 |
|
Information (51) |
18 |
6 |
11 |
200.0 |
63.6 |
7 |
|
Financial Activities (52, 53) |
21 |
23 |
32 |
-8.7 |
-34.4 |
-11 |
|
Professional and Business Services (54-56) |
78 |
78 |
102 |
0.0 |
-23.5 |
-24 |
|
Educational and Health Services (61-62) |
103 |
120 |
92 |
-14.2 |
12.0 |
11 |
|
Leisure and Hospitality (71-72) |
82 |
98 |
113 |
-16.3 |
-27.4 |
-31 |
|
Other Services, except Public Admin. (81) |
23 |
34 |
30 |
-32.4 |
-23.3 |
-7 |
| Government |
140 |
108 |
110 |
29.6 |
27.3 |
30 |
|
Federal Government |
21 |
24 |
19 |
-12.5 |
10.5 |
2 |
|
State Government |
22 |
13 |
23 |
69.2 |
-4.3 |
-1 |
|
Local Government |
97 |
71 |
68 |
36.6 |
42.6 |
29 |
|
Local Education |
21 |
35 |
29 |
-40.0 |
-27.6 |
-8 |
| Unclassified |
82 |
66 |
77 |
24.2 |
6.5 |
5 |
|
|
|
|
|
|
|
| Laramie County |
|
|
|
|
|
|
|
|
|
|
|
|
|
| Total Claims Filed |
174 |
193 |
134 |
-9.8 |
29.9 |
40 |
|
|
|
|
|
|
|
| Goods-Producing |
40 |
69 |
24 |
-42.0 |
66.7 |
16 |
|
Construction (23) |
38 |
58 |
15 |
-34.5 |
153.3 |
23 |
| Service-Providing |
106 |
101 |
93 |
5.0 |
14.0 |
13 |
|
Trade, Transportation, and Utilities (22,42,44-45,48-49) |
43 |
33 |
30 |
30.3 |
43.3 |
13 |
|
Financial Activities (52, 53) |
8 |
7 |
6 |
14.3 |
33.3 |
2 |
|
Professional and Business Services (54-56) |
21 |
20 |
29 |
5.0 |
-27.6 |
-8 |
|
Educational and Health Services (61-62) |
16 |
12 |
10 |
33.3 |
60.0 |
6 |
|
Leisure and Hospitality (71-72) |
9 |
15 |
13 |
-40.0 |
-30.8 |
-4 |
| Government |
20 |
18 |
15 |
11.1 |
33.3 |
5 |
| Unclassified |
8 |
5 |
2 |
60.0 |
300.0 |
6 |
|
|
|
|
|
|
|
| Natrona County |
|
|
|
|
|
|
|
|
|
|
|
|
|
| Total Claims Filed |
180 |
134 |
180 |
34.3 |
0.0 |
0 |
|
|
|
|
|
|
|
| Goods-Producing |
76 |
44 |
63 |
72.7 |
20.6 |
13 |
|
Construction (23) |
26 |
31 |
28 |
-16.1 |
-7.1 |
-2 |
| Service-Providing |
87 |
78 |
104 |
11.5 |
-16.3 |
-17 |
|
Trade, Transportation, and Utilities (22,42,44-45,48-49) |
34 |
19 |
27 |
78.9 |
25.9 |
7 |
|
Financial Activities (52, 53) |
2 |
3 |
6 |
-33.3 |
-66.7 |
-4 |
|
Professional and Business Services (54-56) |
10 |
20 |
12 |
-50.0 |
-16.7 |
-2 |
|
Educational and Health Services (61-62) |
20 |
17 |
17 |
17.6 |
17.6 |
3 |
|
Leisure and Hospitality (71-72) |
17 |
16 |
28 |
6.3 |
-39.3 |
-11 |
| Government |
11 |
7 |
7 |
57.1 |
57.1 |
4 |
| Unclassified |
6 |
5 |
6 |
20.0 |
0.0 |
0 |