Wyoming’s New Business Formation in 2006 and 2007
The number of new firms in Wyoming during 2006 and 2007 reached record highs, although the over-the-year rate of increase slowed significantly in 2007. Fewer new mining firms opened for business in 2007 than in 2006, but mining was still the fourth largest job provider and the second largest wage generator among all industries’ new firms.
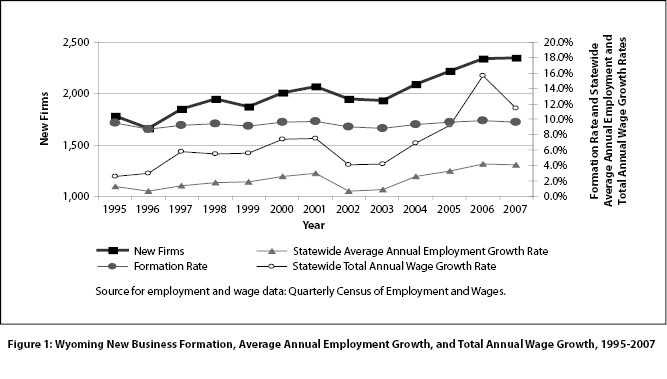
From 2005 to 2007, Wyoming’s economy experienced the fastest growth in more than a decade (see Figure 1). The state’s average annual employment grew by 3.3% (8,109 jobs) in 2005, 4.2% (10,708 jobs) in 2006, and 4.1% (10,864 jobs) in 2007. Total wages grew by 9.3% ($717 million), 15.6% ($1.3 billion), and 11.4% ($1.1 billion), respectively. The pace of employment and total wage growth slowed markedly in 2007 compared to 2006, yet 2007 still had the second fastest growth in more than a decade.
Economic expansion is caused by growth in existing firms and the creation of new businesses. New businesses contribute fresh opportunities to the economy, such as additional jobs, wages, and tax revenue for the state and for local communities. The industry distribution of new firms may indicate emerging directions of economic growth. This article focuses on new business formation during the period of significant economic growth in 2006 and 2007.
Business FormationIn this article, a new business is defined as a business not previously in existence that actively provides goods or services and hires and pays wages to employees (Wen, 2005). New branches of existing firms or the reopening of firms after temporarily closing (up to eight quarters) are not defined as new businesses for purposes of this research.
A total of 2,342 new firms opened in Wyoming during 2006, 124 more than in 2005. Another 2,352 new businesses opened in 2007, only 10 more than in the previous year. Both years had a record high number of new firms, but the over-the-year change in new business formation slowed significantly in 2007 (only 0.43%). During the previous three years, the over-the-year change was 8.4% in 2004, 5.9% in 2005, and 5.6% in 2006. This significant slowdown was consistent with the statewide employment and total wage changes mentioned previously.
The business formation rate was calculated as the number of new firms divided by the sum of existing and new firms. The rate was 9.8% in 2006 and 9.6% in 2007. Figure 1 shows that the formation rate was relatively stable regardless of overall economic expansion or contraction (between 8.8% and 9.8% over the past 13 years) and was affected only slightly by the rate of economic growth. This is consistent with results of national research (Sadeghi, 2008) showing that the annual U.S. new business formation rate was between 11.9% and 13.5% with an overall downward trend for the same 13-year period.
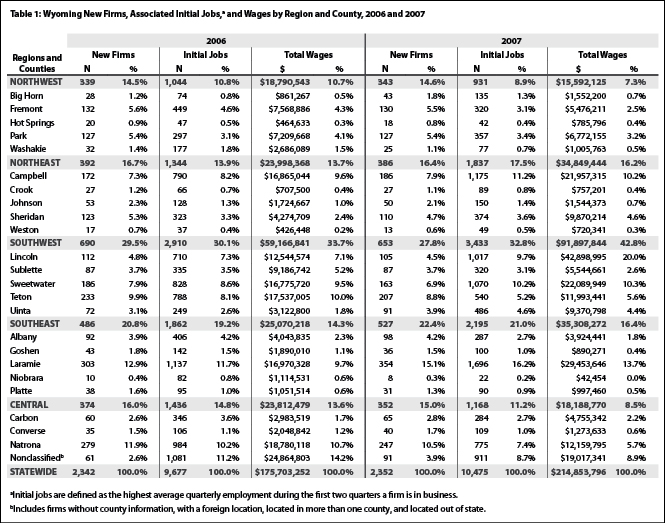
New firms provided 9,677 initial jobs in 2006 and 10,475 jobs in 2007 (see Table 1). These represented 3.6% and 3.8% of average statewide employment, respectively. Initial jobs are defined as the highest average quarterly employment during the first two quarters a firm is in business. New firms also contributed $175.7 million and $214.9 million in associated total wages, representing 1.8% and 2.0% of state total wages for 2006 and 2007, respectively.
The following analysis focuses on 2007 data, with data from additional years included for comparison.
Regional Business FormationAmong the state’s five regions, the southwest region attracted the most new firms in 2007 (653, or 27.8%), followed by the southeast region with 527 firms (22.4%). The northeast region added 386 firms (16.4%), while the central region expanded by 352 new firms (15.0%), and 343 new firms (14.6%) were added in the northwest region. The associated initial jobs were distributed similarly among regions. Of the 10,475 jobs added by new firms in 2007, nearly one-third (32.8%) were in the southwest region. The southwest region also shared the largest portion of new firms’ associated wages with $91.9 million (42.8%).
Among the counties, Laramie County gained the most new firms (354) and jobs (1,696). Natrona County had the second highest number of new firms (247) and Teton County followed with 207 new firms. However, Natrona and Teton counties gained only 775 and 540 associated initial jobs, respectively, in 2007. These job gains were substantially less than Campbell (1,175 jobs), Sweetwater (1,070 jobs), and Lincoln (1,017 jobs) counties. This means that new firms that opened in Natrona and Teton counties were mostly smaller businesses.
New firms located in Lincoln County contributed the largest portion of associated total wages ($42.9 million, or 20.0%), although it ranked ninth among the counties for new firms (105). Laramie County had the second largest portion of wages ($29.5 million), followed by Sweetwater County ($22.1 million) and Campbell County ($22 million). Natrona and Teton counties gained only $12.2 million and $12 million, respectively.
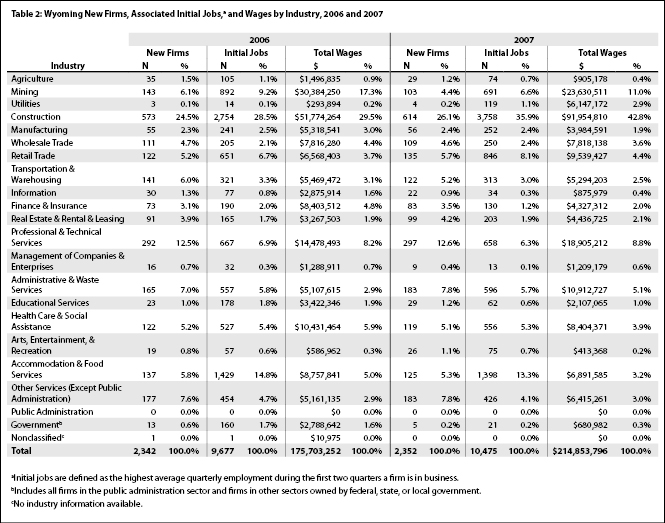
New Businesses by IndustryIn 2007 construction led all industries in the number of new firms (614, or 26.1%), initial jobs (3,758), and total payroll ($92 million; see Table 2). Professional & technical services had the second largest number of new firms with 297 (12.6%). Accommodation & food services and retail trade contributed the second and third largest numbers of jobs (1,398 and 846, respectively). The next largest additions to wages were in mining ($23.6 million) and professional & technical services ($18.9 million).
New firm creation in mining slowed notably in 2007 (103 firms, or 4.4%) compared to 2006 (143 firms, or 6.1%), as did the associated jobs and wages. The number of jobs created dropped from 892 in 2006 to 691 in 2007, while associated wages fell from $30.4 million to $23.6 million. This could have been due to the same reasons that caused the statewide oil and gas drilling slowdown (Moen, 2008): a lack of space in the pipelines, environmental restrictions to protect wildlife, and a lack of new permits to drill on federal land. Despite these issues, mining was the fourth largest job provider and the second largest wage contributor among all industries in 2007 for new firms.
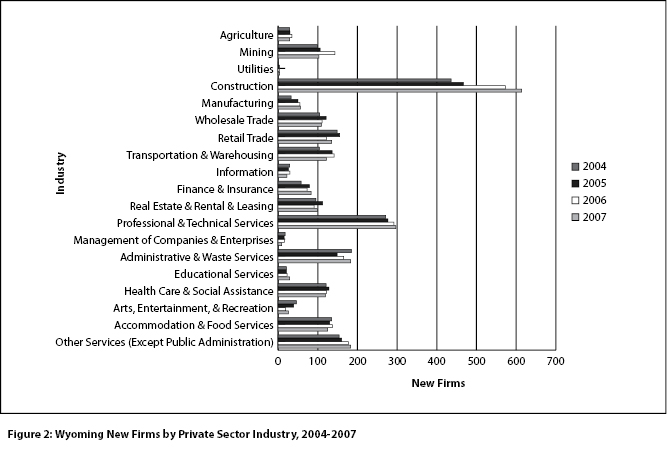
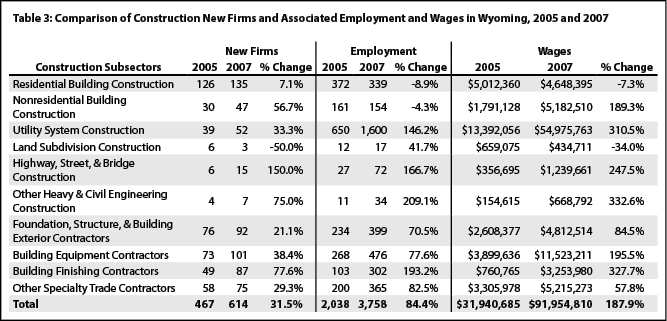
Figure 2 shows that construction not only kept the historical lead in new business formation but also had significant increases in 2006 and 2007 compared to previous years. Compared to 2005, the number of new construction firms in 2007 increased 31.5% (467 to 614; see Table 3), the associated jobs almost doubled (84.4%; 2,038 to 3,758), and the related wages nearly tripled (187.9%; $31.9 million to $92 million). Within subsectors, however, there were wide variations in growth. The land subdivision construction and residential building construction subsectors were the only ones that showed a decrease or a single-digit percentage increase in the number of new firms. All other construction subsectors experienced double- or even triple-digit percentage increases. Most of the job and wage growth occurred in utility system construction, which is primarily related to oil and gas pipelines. In 2007, new firms in utility system construction added 1,600 jobs and $55 million in wages, compared to 650 jobs and $13.4 million in 2005.
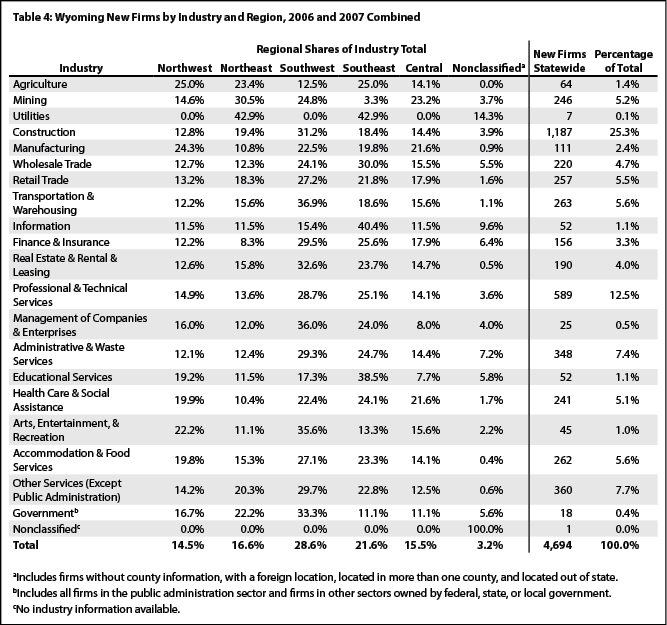
Table 4 shows the distribution of the 4,694 new firms in 2006 and 2007 combined by industry and region. A number of factors influenced the distribution, including local natural resources, transportation conditions, population, geographic location, and the timing of projects such as highway and pipeline construction. For example, the northeast region attracted the largest portion (30.5%) of new mining firms, while the southeast region acquired only 3.3% of new mining firms. On the other hand, the southeast region attracted 40.4% of new information businesses while the northeast had only 11.5% of new firms in this industry. As the fastest growth area (with 28.6% of total new firms), the southwest region added a substantial percentage of new firms across a wide range of industries. It added approximately one-third of new firms in construction (31.2%), transportation & warehousing (36.9%), real estate & rental & leasing (32.6%), management of companies & enterprises (36.0%), arts, entertainment, & recreation (35.6%), and government (33.3%).
Business SurvivalDue to the limited availability of information on business changes (selling, merging, splitting, etc.), this article analyzes the survival of a business only under its original owner. A firm still reporting its employment and wage information to the Unemployment Insurance Tax Division of the Wyoming Department of Employment one year after its creation is considered to have survived one year. The same method is used to define two-year survival, three-year survival, and so on. The one-year survival rate is the number of one-year survivals divided by the total number of firms that opened for business one year prior. The two-year survival rate is the number of two-year survivals divided by the total number of new firms opened two years prior. The same method is applied to other survival rates.
The length of survival for a new business depends on many factors, such as market demand for the specific product or service the firm provides, competition from similar businesses, government policies, required labor, and business location. Knowing a firm’s probability of survival before deciding what kind of business to start and where to locate could help prospective business owners to project future success.
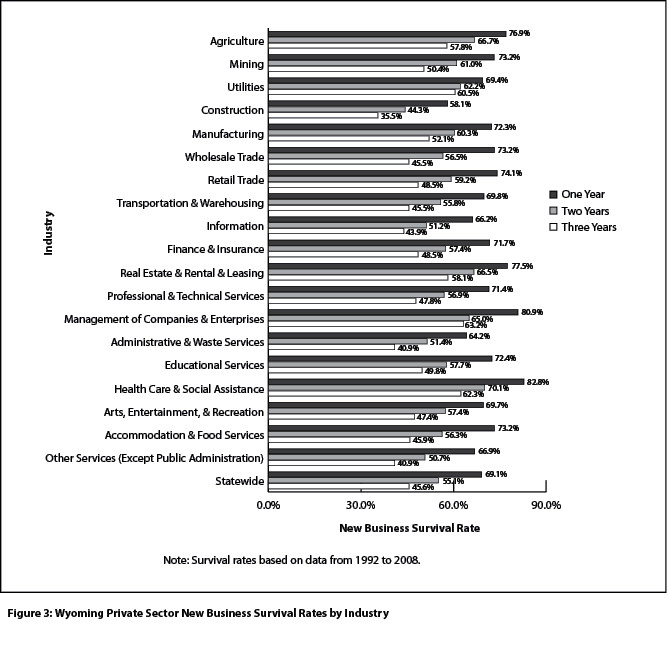
Figure 3 shows that more than two-thirds (69.1%) of new firms in Wyoming survived one year in business. More than half (55.1%) survived two years. As a general rule, the survival rate decreases as the years increase. Only 45.6% of new firms were in business three years after formation.
Firms in health care & social assistance had the best one-year survival rate (82.8%), followed by firms in management of companies & enterprises (80.9%) and real estate & rental & leasing (77.5%). The construction industry has historically had the largest percentage of new firms (26.1% in 2007). However, firms in this industry had the poorest survival rates. Only 58.1% were active after one year in business and 35.5% survived three years. This was most likely due to construction firms’ dependence on temporary projects, such as repairing highways and construction of bridges and pipelines.
The industries with the best three-year survival rate were management of companies & enterprises (63.2%), health care & social assistance (62.3%), and utilities (60.5%). However, with the exception of health care & social assistance, there were few new firms in these industries each year and their associated initial jobs were very limited. In addition, construction, accommodation & food services, and retail trade (the top three industries for creating new jobs in 2007) all had a three-year survival rate lower than 50%.
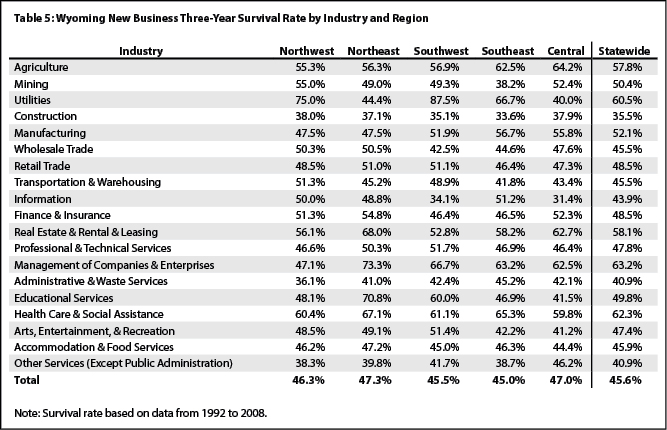
Firms in various industries may face significantly different survival challenges in different areas of the state. For example, 87.5% of utilities firms in the southwest region were still active after three years, but only 40.0% in the central region were still active (see Table 5). Agriculture firms had better chances of surviving in the central and southeast regions (64.2% and 62.5%, respectively) than any of the other three regions. Firms in educational services fared much better in the northeast region (70.8%) compared to those in the central region (41.5%).
SummaryA total of 2,342 and 2,352 new firms opened for business in Wyoming during 2006 and 2007, respectively. These new firms provided 9,677 and 10,475 associated initial jobs to the state and contributed $175.7 million and $214.9 million in associated total wages. The southwest, southeast, and northeast regions had the most new firms in those two years. Due to oil and gas pipeline-related construction, new firms’ associated jobs and wages experienced a large increase in the construction industry. The number of new firms in mining decreased in 2007 after steadily increasing over the past several years, but mining still ranked as the fourth largest job provider among all industries and the second largest wage contributor among new firms.
ReferencesMoen, B. (2008, January 23). Gas, oil drilling drops in ’07. Casper Star-Tribune. Retrieved February 9, 2009, from http://www.trib.com/articles/2008/01/23/news/
wyoming/3ab2594cfee56c4b872573d90004af8c.txt
Sadeghi, A. (2008, December). The births and deaths of business establishments in the United States. Monthly Labor Review, 131(12). Retrieved February 9, 2009, from http://www.bls.gov/opub/mlr/2008/12/art1abs.htm
Wen, S. (2005, January). New firms, new directions: Business formation in Wyoming. Wyoming Labor Force Trends, 42(1). Retrieved January 5, 2009, from http://doe.state.wy.us/LMI/0105/a1.htm
Return to text
Return to text
Return to text
Return to text
Return to text
Return to text
Return to text
Return to text
Last modified on
by April Szuch.
