Covered Employment and Wages for Second Quarter 2008: Slight Slowdown in Total Payroll Growth
According to third quarter 2008 estimates for state personal income by the U.S. Bureau of Economic Analysis, Wyoming had the fastest personal income growth of any state and was one of two states where personal income growth did not slow from second to third quarter. Total payroll and employment increased in 21 of Wyoming’s 23 counties.
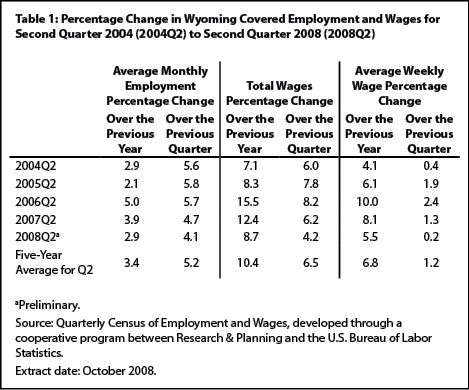
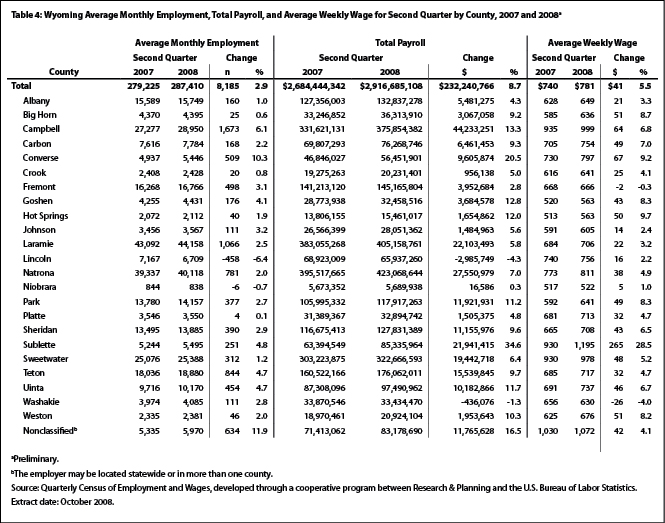
From second quarter 2007 to second quarter 2008, total Unemployment Insurance (UI) covered payroll increased by $232.2 million (8.7%). This increase was slightly lower than the five-year average (see Table 1). UI covered payroll represents approximately 92% of all wage and salary disbursements and 45% of personal income in the state (U.S. Bureau of Economic Analysis, 2007). Employment grew by 8,185 jobs (2.9%) in second quarter 2008 and average weekly wage rose by $41 (5.5%). Total payroll is an important economic indicator because it is often associated with consumption, retail sales, and sales tax revenue (Black & Evans, 1997).
The U.S. Bureau of Economic Analysis recently released its estimates for state personal income for third quarter 2008. According to the estimates, Wyoming had the fastest personal income growth of any state and was one of two states where personal income growth did not slow from second to third quarter (U.S. Bureau of Economic Analysis, 2008). The total payroll is an important component of personal income.
The covered payroll and employment data in this article are measured by place of work as compared to the labor force estimates, which are a measure of employed and unemployed persons by place of residence.
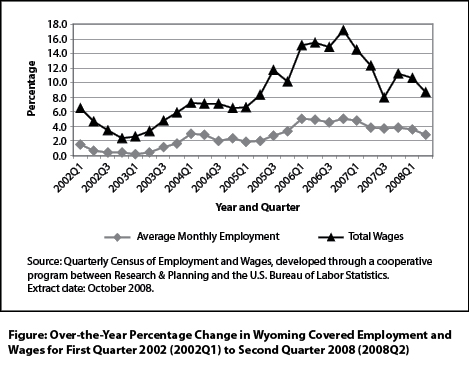
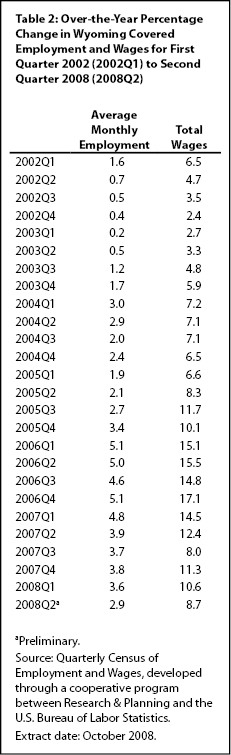
The Figure shows that payroll growth peaked at 17.1% in fourth quarter 2006, decreased to 8.0% in third quarter 2007, and stood at 8.7% in second quarter 2008. During much of 2007, total payroll in Wyoming grew twice as fast as in the U.S. (U.S. Bureau of Labor Statistics, 2008). Wyoming employment growth was near 5.0% during 2006, but gradually decelerated to 2.9% in second quarter 2008 (see Table 2).
Statewide Employment and Wages by IndustryThe purpose of this article is to show employment and payroll changes between second quarter 2007 and second quarter 2008. These economic changes help gauge the overall strength of Wyoming’s economy and identify the fastest and slowest growing sectors and geographic areas.
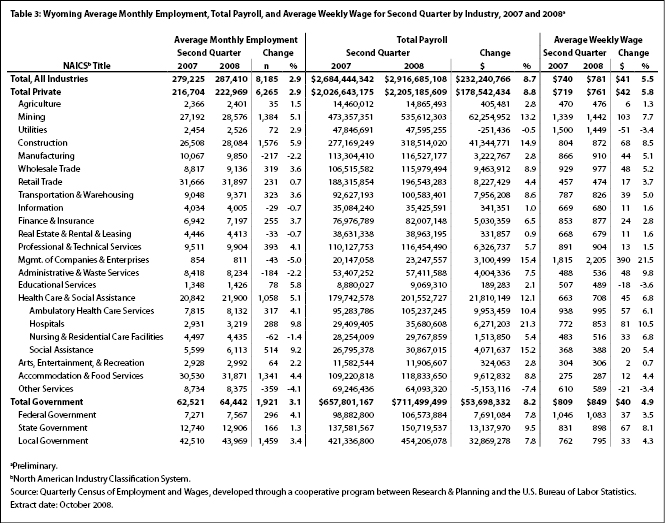
Table 3 shows that in second quarter 2008 the most jobs were added in construction, local government (including public schools, colleges, and hospitals), mining (including oil & gas), accommodation & food services, and health care & social assistance. Double-digit payroll growth occurred in six industries (mining, construction, management of companies & enterprises, ambulatory health care services, private hospitals, and social assistance).
Wyoming’s construction sector added 1,576 jobs (5.9%) and its total payroll increased by $41.3 million (14.9%). Construction of buildings added fewer than 100 jobs, heavy & civil engineering construction added almost 600 jobs, and specialty trade contractors added approximately 900 jobs. As in previous quarters, payroll and employment increased rapidly in oil & gas pipeline & related structures construction.
Local government (including public schools, colleges, and hospitals) saw its total payroll grow by $32.9 million (7.8%) and employment increase by 1,459 jobs (3.4%). Public administration (including cities, towns, and counties) added approximately 500 jobs, educational services added almost 500 jobs, hospitals added almost 200 jobs, and arts, entertainment, & recreation (including gambling) added more than 200 jobs.
Total payroll in mining increased by $62.3 million (13.2%), the largest increase of any sector, and employment grew by 1,384 jobs (5.1%). Oil & gas extraction added more than 300 jobs, mining (except oil & gas) added almost 600 jobs, and support activities for mining added more than 450 jobs. Strong growth occurred in coal mining.
In second quarter 2008, accommodation & food services added 1,341 jobs (4.4%) and its payroll increased by $9.6 million (8.8%). Approximately 900 jobs were added in accommodation and approximately 400 jobs were added in food services & drinking places.
Health care & social assistance added 1,058 jobs (5.1%) and its total payroll grew by $21.8 million (12.1%). The largest job growth occurred in social assistance (514 jobs, or 9.2%), but part of this increase was the result of a noneconomic code change of a large employer from other services. Ambulatory health care services gained 317 jobs (4.1%) and its payroll increased by $10.0 million (10.4%). Employment and total payroll in private hospitals increased rapidly, gaining 288 jobs (9.8%) and $6.3 million in wages (21.3%).
Employment decreased in a number of sectors, including manufacturing, information, real estate & rental & leasing, management of companies & enterprises, administrative & waste services, and other services. Total payroll decreased in two sectors: utilities and other services.
Manufacturing employment fell by 217 jobs (-2.2%), but total payroll increased by $3.2 million (2.8%). Significant job losses in wood product manufacturing (more than 250 jobs) were partially offset by job gains in petroleum & coal products manufacturing (approximately 100 jobs).
Total payroll increased by $341,351 (1.0%) in the information sector, but employment decreased by 29 jobs (-0.7%). Minor job losses were seen in publishing, motion picture & sound recording, broadcasting, and data processing, hosting & related services. These job losses were partially offset by gains in telecommunications.
In second quarter 2008, employment fell by 33 jobs (-0.7%) in real estate & rental & leasing. Employment increased in real estate, but fell in rental & leasing services. Total payroll increased by $331,857 (0.9%).
Management of companies & enterprises lost 43 jobs (-5.0%). The large increase in total payroll ($3.1 million, or 15.4%) was partially the result of a sizeable bonus.
Employment decreased by 184 jobs (-2.2%) in administrative & waste services, but total payroll increased by $4.0 million (7.5%). Job losses in employment services (including temporary help agencies and professional employer organizations) were partially offset by job gains in waste management & remediation services and investigation & security services.
Other services lost 359 jobs (-4.1%) and its total payroll decreased by $5.2 million (-7.4%). Employment increased in personal & laundry services, but fell in repair & maintenance services, membership associations & organizations, and private households. In a noneconomic code change, a large employer was moved from membership associations & organizations to social assistance.
Total payroll fell by $251,436 (-0.5%) in utilities. Large bonuses were paid in second quarter 2007, but not repeated in 2008.
Employment and Wages by CountyTable 4 shows that both total payroll and employment increased in 21 of Wyoming’s 23 counties.
Campbell County added 1,673 jobs (6.1%) and its total payroll increased by $44.2 million (13.3%). Mining (including oil & gas) added more than 450 jobs and construction added more than 400 jobs. Growth was also seen in retail trade, administrative & waste services, health care & social assistance, other services, and local government, each of which added approximately 100 jobs.
Teton County’s total payroll rose by $15.5 million (9.7%) and its employment increased by 844 jobs (4.7%). The largest job gains occurred in accommodation & food services (more than 600 jobs). Employment also increased in construction; retail trade; transportation & warehousing; and arts, entertainment, & recreation.
Converse County added 509 jobs (10.3%) and total payroll grew by $9.6 million (20.5%). Construction employment increased by more than 300 jobs. Job gains were also seen in mining and local government (approximately 50 jobs each).
Fremont County added 498 jobs (3.1%) and total payroll rose by $4.0 million (2.8%). Employment decreased slightly in manufacturing, information, and health care & social assistance. Local government gained almost 300 jobs, and smaller job gains were seen in wholesale trade, retail trade, and other services.
Uinta County’s total payroll increased by $10.2 million (11.7%) and employment grew by 454 jobs (4.7%). Construction posted the largest job gains (more than 150 jobs), followed by accommodation & food services (approximately 100 jobs), mining (approximately 100 jobs), and transportation & warehousing (more than 50 jobs). Employment fell slightly in retail trade, real estate & rental & leasing, and administrative & waste services.
In Lincoln County total payroll decreased by $3.0 million (-4.3%) and employment fell by 458 jobs (-6.4%). Employment and wages in the construction sector fell dramatically in second quarter 2008 (a decrease of approximately 550 jobs and $6.7 million in payroll). Some of this decrease in construction may have been related to the completion of a large project. Minor job losses in manufacturing, retail trade, and accommodation & food services were partially offset by gains in mining and local government.
Niobrara County’s employment and total payroll were essentially unchanged from a year earlier. Employment fell by 6 jobs (-0.7%), but total payroll increased by $16,586 (0.3%). Job gains in state government and local government were offset by minor job losses in mining and other sectors.
Washakie County’s total payroll fell by $436,076 (-1.3%) but employment grew by 111 jobs (2.8%). The decrease in total payroll was mostly the result of large bonuses paid in second quarter 2007, but not repeated in 2008.
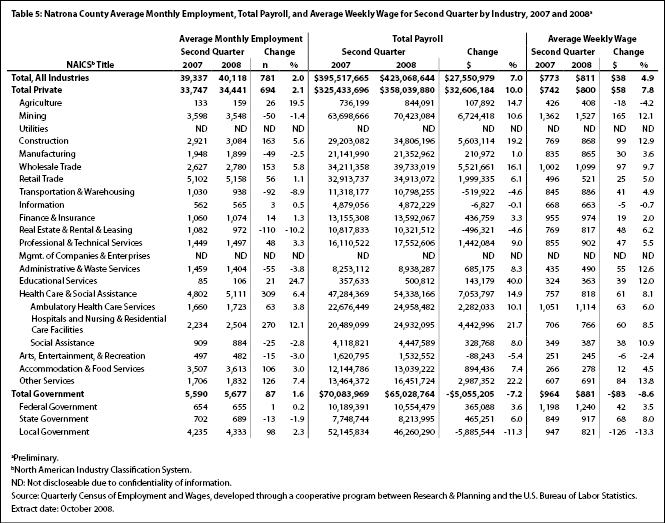
Natrona County (see Table 5) gained 781 jobs (2.0%) in second quarter 2008. Its total payroll increased by $27.6 million (7.0%). Health care & social assistance added 309 jobs (6.4%) and its total payroll grew by $7.1 million (14.9%). Other large job gains were seen in construction (163 jobs, or 5.6%), wholesale trade (153 jobs, or 5.8%), and other services (126 jobs, or 7.4%). Notable job losses occurred in real estate & rental & leasing (-110 jobs, or -10.2%) and transportation & warehousing (-92 jobs, or -8.9%).
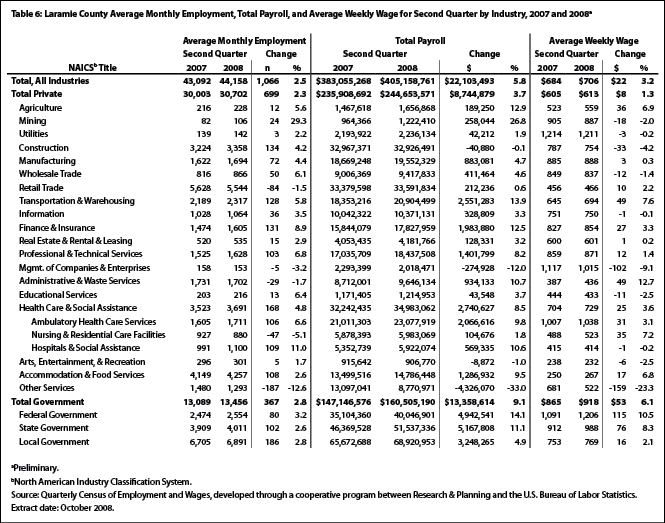
Table 6 shows that employment increased in Laramie County by 1,066 jobs (2.5%) in second quarter 2008. The largest job gains were seen in local government (including public schools, colleges, and hospitals; 186 jobs, or 2.8%), health care & social assistance (168 jobs, or 4.8%), construction (134 jobs, or 4.2%), finance & insurance (131 jobs, or 8.9%), and transportation & warehousing (128 jobs, or 5.8%). Employment fell in other services (-187 jobs, or -12.6%), retail trade (-84 jobs, or -1.5%), administrative & waste services (-29 jobs, or -1.7%), and management of companies & enterprises (-5 jobs, or -3.2%).
In summary, payroll growth and job growth both slowed in second quarter 2008 and fell below their five-year averages. Although construction added the largest number of new jobs, four other sectors (local government, mining, accommodation & food services, and health care & social assistance) each added more than 1,000 jobs. The vast majority of counties in the state saw increases in jobs and total payroll.
ReferencesBlack, D., & Evans, M. (1997, May). Work, pay and consumer spending, part one: Sales tax collections and total payroll. Wyoming Labor Force Trends, 34(5), Retrieved September 11, 2008, from http://doe.state.wy.us/LMI/0597/0597a2.htm
U.S. Bureau of Economic Analysis. (2007, May 15). SA04 State income and employment summary – Wyoming. Retrieved May 15, 2007, from http://www.bea.gov/regional/spi/default.cfm
U.S. Bureau of Economic Analysis. (2008, December 18). State personal income: Third quarter 2008. Retrieved December 22, 2008, from http://www.bea.gov/newsreleases/regional/spi/2008/pdf/spi1208.pdf
U.S. Bureau of Labor Statistics. (2008, December 22). Quarterly Census of Employment and Wages. Retrieved December 22, 2008, from http://data.bls.gov/PDQ/outside.jsp?survey=en
Return to text
Return to text
Return to text
Return to text
Return to text
Return to text
Return to text
Last modified on
by April Szuch.